The HYPE Hyperliquid token is down 22% from an all-time high of $75, making the 2026 uptrend a key test of support. Market share has fallen in derivatives markets, while cash flows are showing early signs of stabilization after sturdy selling pressure in early June.
The $50-$54 area currently stands out as the most crucial support zone below current prices and the first major test of the trend since January.
Spot selling becomes easier for HYPE
HYPE fell below $60 on Wednesday after rejecting another retest of its all-time high near $76. The decline pushed the price toward the 50-day exponential moving average, a level that acted as trend support throughout the March rally.
The recent pullback is reminiscent of HYPE’s consolidation in May 2025. At that time, the token made a recent high near $40 before entering a multi-week pause that cooled momentum without causing a bearish breakout on the daily chart.
HYPE Price Comparison, July 2026 and May 2025 Source: Cointelegraph/TradingView
The relative strength index is behaving similarly, retreating from overbought conditions while remaining above levels typically associated with trend reversals.
However, onchain data paints a cautious picture. Aggregate spot volume delta (CVD), which measures net buying and selling activity in spot markets, improved from recent lows during the correction. The recovery has narrowed the prior sales imbalance, although CVD remains deeply negative at nearly $95 million.
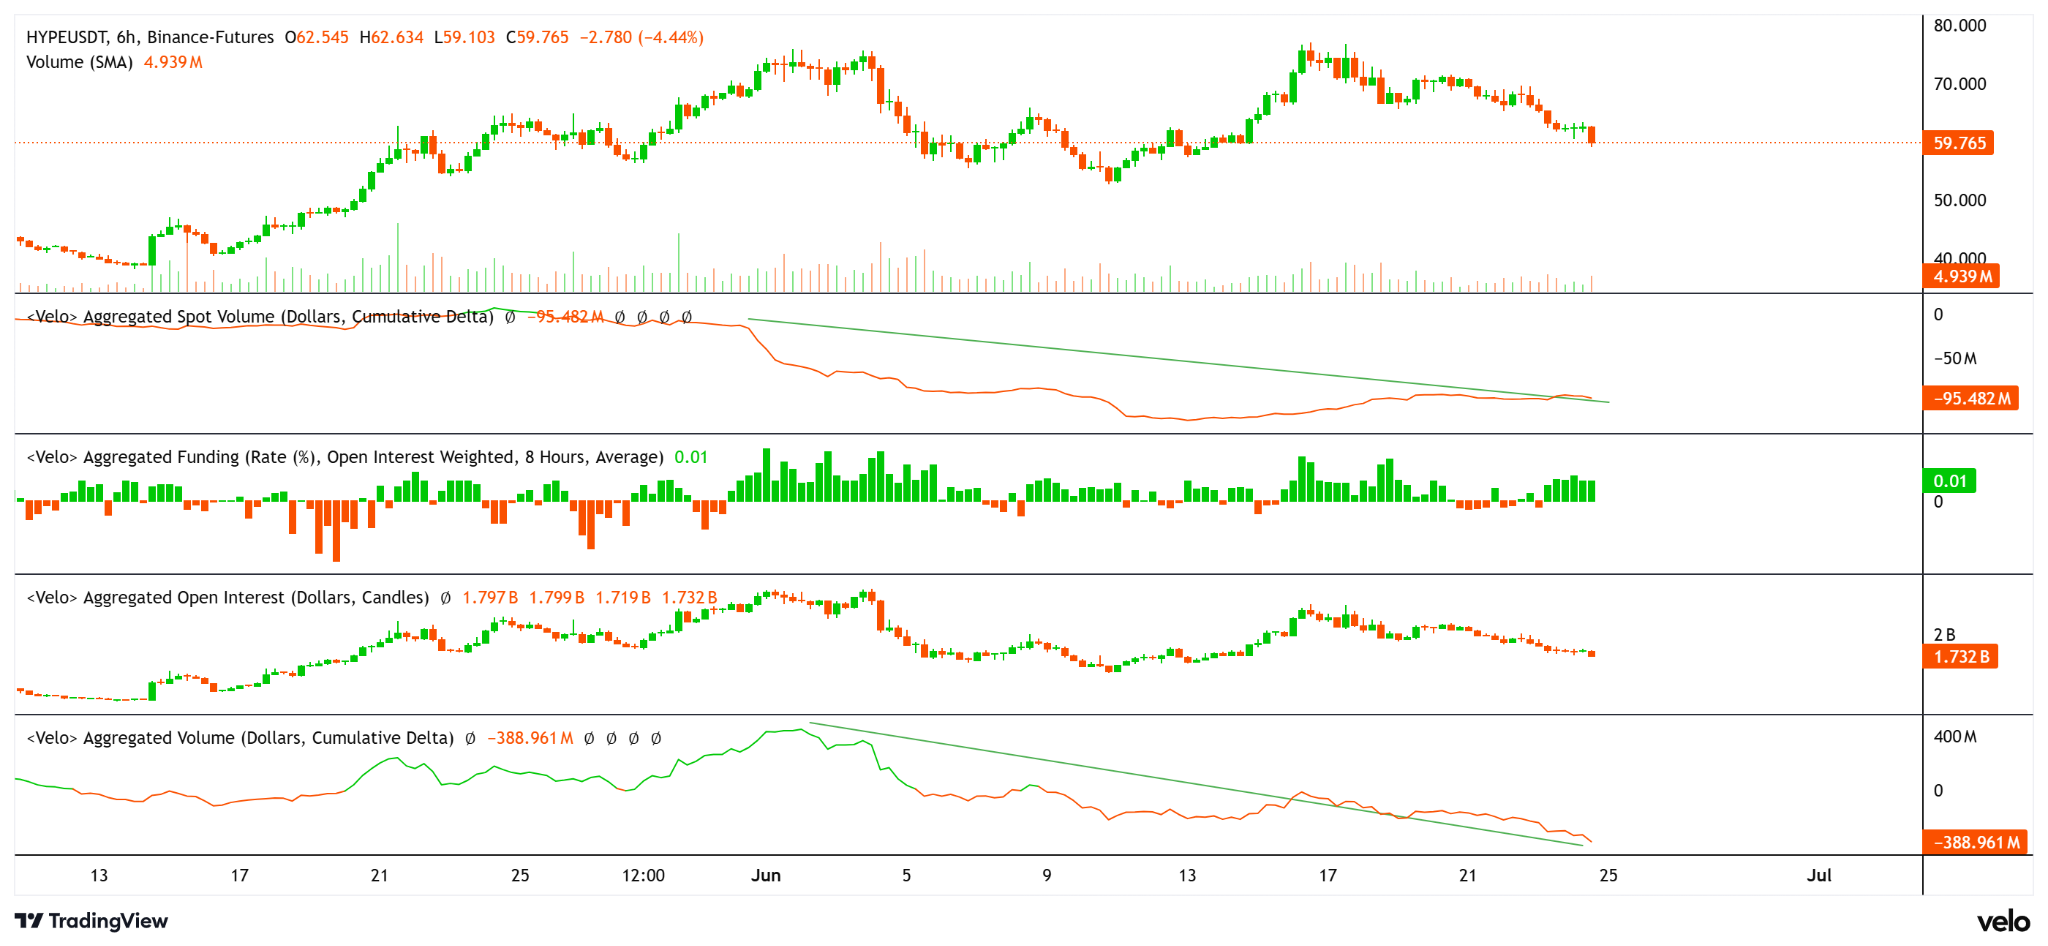
HYPE price, open interest, spot and futures CVD, funding rate. source: Velo
This change suggests that selling pressure is easing, rather than aggressive accumulation. Spot buyers have begun to absorb supply at current levels, although the scale of demand remains modest compared to the $110 million in sales recorded during HYPE’s decline from $76 in early June.
Derivatives activity continues to weaken. Open interest fell to $1.73 billion from $2.2 billion, while derivatives CVD continues to trend down and is now at near negative $389 million, down from $400 million in early June. Currently, it appears that HYPE traders are reducing their exposure rather than opening recent positions.
Related: Solana Acquires 95% of Tokenized Capital as Investors Debate Whether SOL Has Hit Bottom
The $50 support comes into focus
The next crucial test is from the $50 to $54 range, where a rising 50-day exponential moving average coincides with an unfilled daily fair value gap. The zone represents the first significant cluster of support below current prices.
Holding above the region preserves the sequence of higher and lower HYPE levels that has remained intact since January. This makes the current pullback consistent with previous consolidations that have developed as part of a broader uptrend.
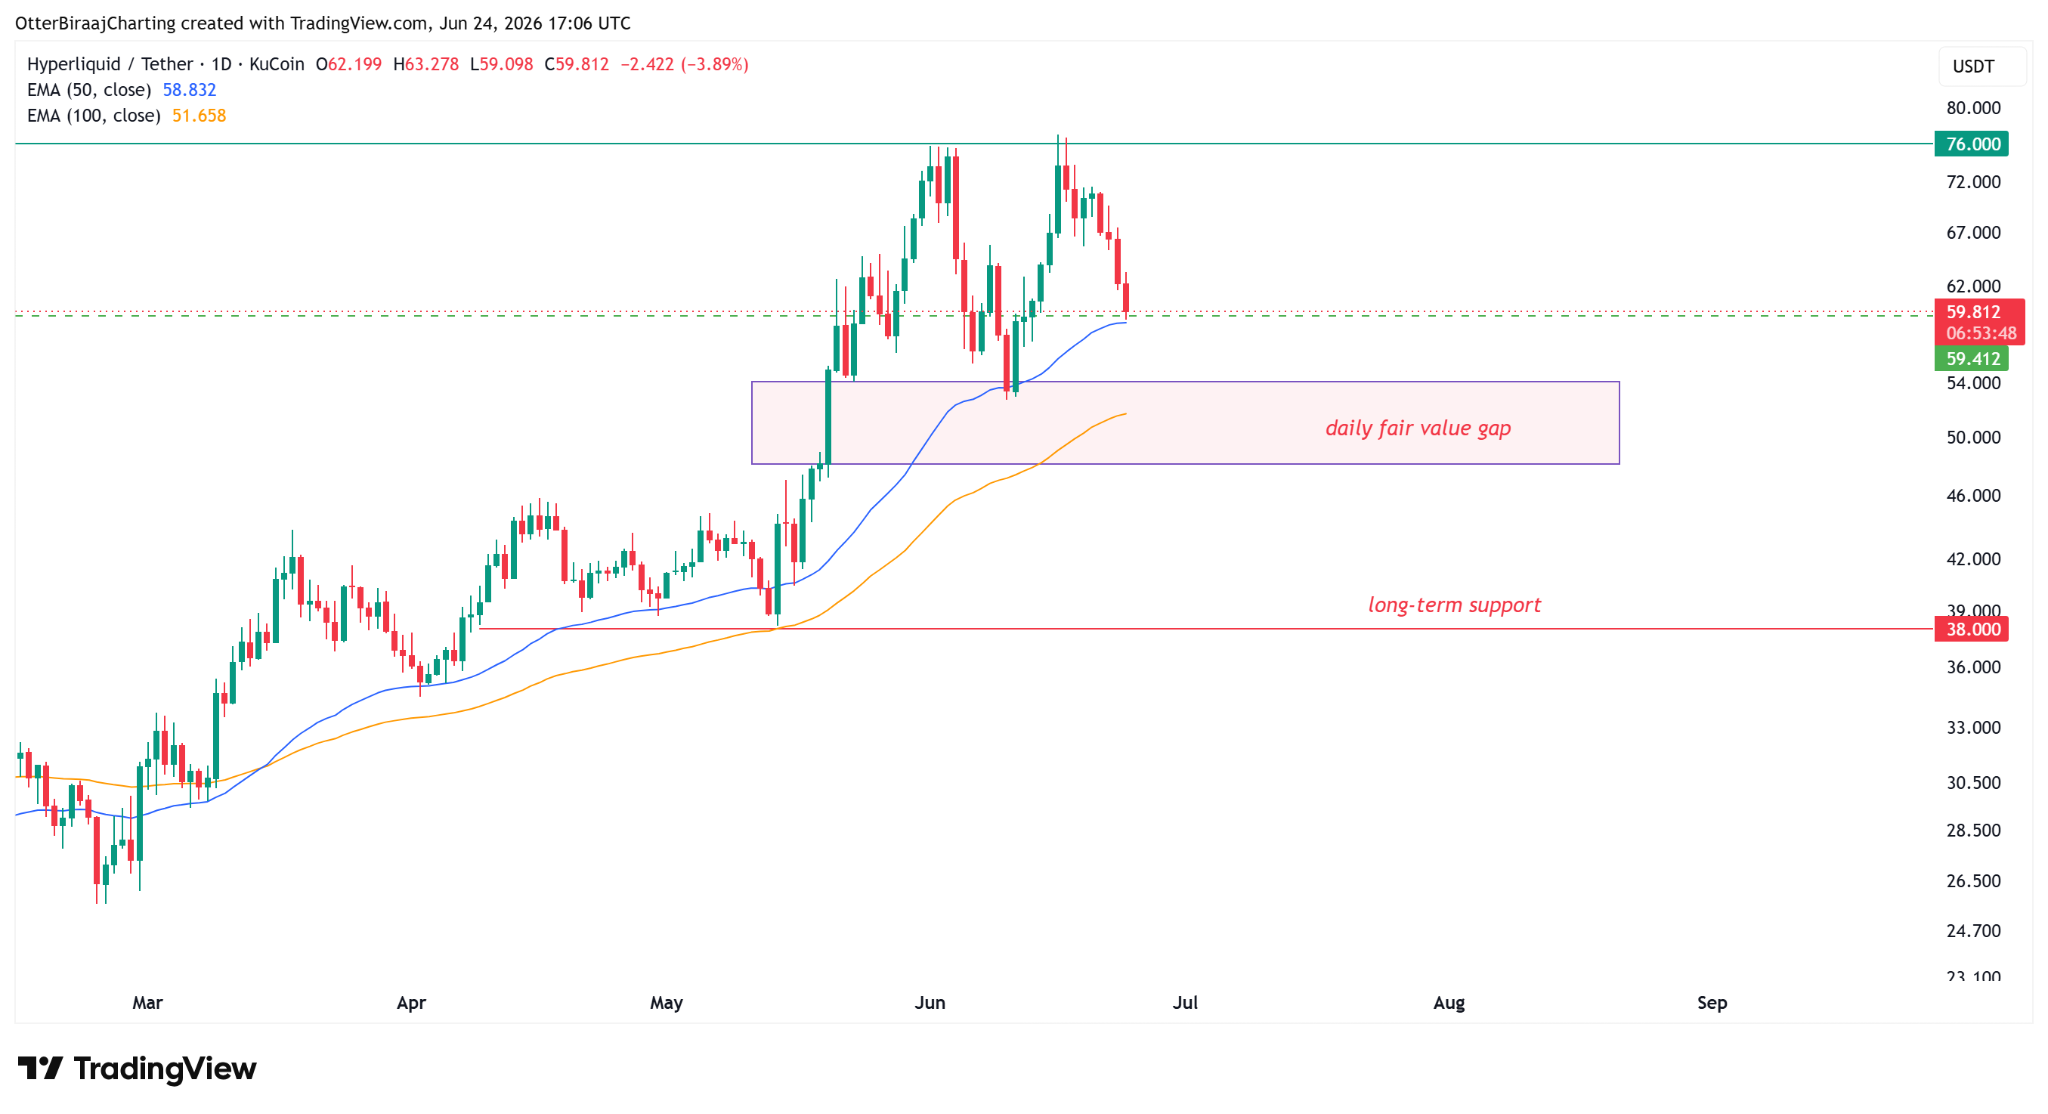
HYPE/USDT, one-day chart. Source: Cointelegraph/TradingView
Closing the day below $53 would mark the first significant bearish change on the daily chart this year. The next level of support becomes the 100-day EMA near $51.6, followed by the lower bound of the fair value gap near $49. Below this, the next significant support area is near $38.
For now, the most crucial signal is the difference between improving spot flows and failing participation in leveraged markets. Demand strength around the $50-54 support zone could clearly indicate whether the HYPE correction is coming to an end or preparing for a deeper pullback.
In terms of accumulation, Altcoin Sherpa cryptocurrency trader he said,
“HYPE, I think anywhere in the 55-64 area is a pretty good place to accumulate this. I think personally by the end of this year the price will go up to $100 and it will still be the best altcoin… but IMO it will also depend heavily on bitcoin.
Related: Bitcoin Crash to 60,000 dollars opens a recent demand zone worth $530 million: will the bulls buy it?