Bitcoin (BTC) traders have shifted their attention lower after futures and order book data indicate powerful buyer interest in the $68,000-70,000 zone.
Selling pressure has increased in derivatives markets, with the daily bid-ask ratio falling to -0.03, showing that sellers are now more aggressive than buyers as investors position themselves near liquidation levels.
Bitcoin buyers are clustering near $68,000
The Visible Range Volume Profile (VRVP) indicator shows the $68,000-$70,000 region as the most densely traded zone on the chart since November 2025. The high trading activity at this price range suggests that most positions have been opened near these levels over the past few months.
Order book data also shows a bid/ask ratio of -0.03, which has remained negative for most of the past month as sell-side activity continued to outweigh aggressive buying pressure.
BTC/USDT price, bid-ask ratio and VPVR profile. source: Hyblock
Liquidation data he adds another pressure point. The heat map shows more than $3.4 billion in cumulative long positions traded at nearly $74,700. This number will rise to $11 billion if Bitcoin falls to $70,000 within the 90-day liquidation period.
Taken together, the positioning data suggests that investors are prioritizing deeper pools of liquidity rather than chasing higher prices above $80,000.
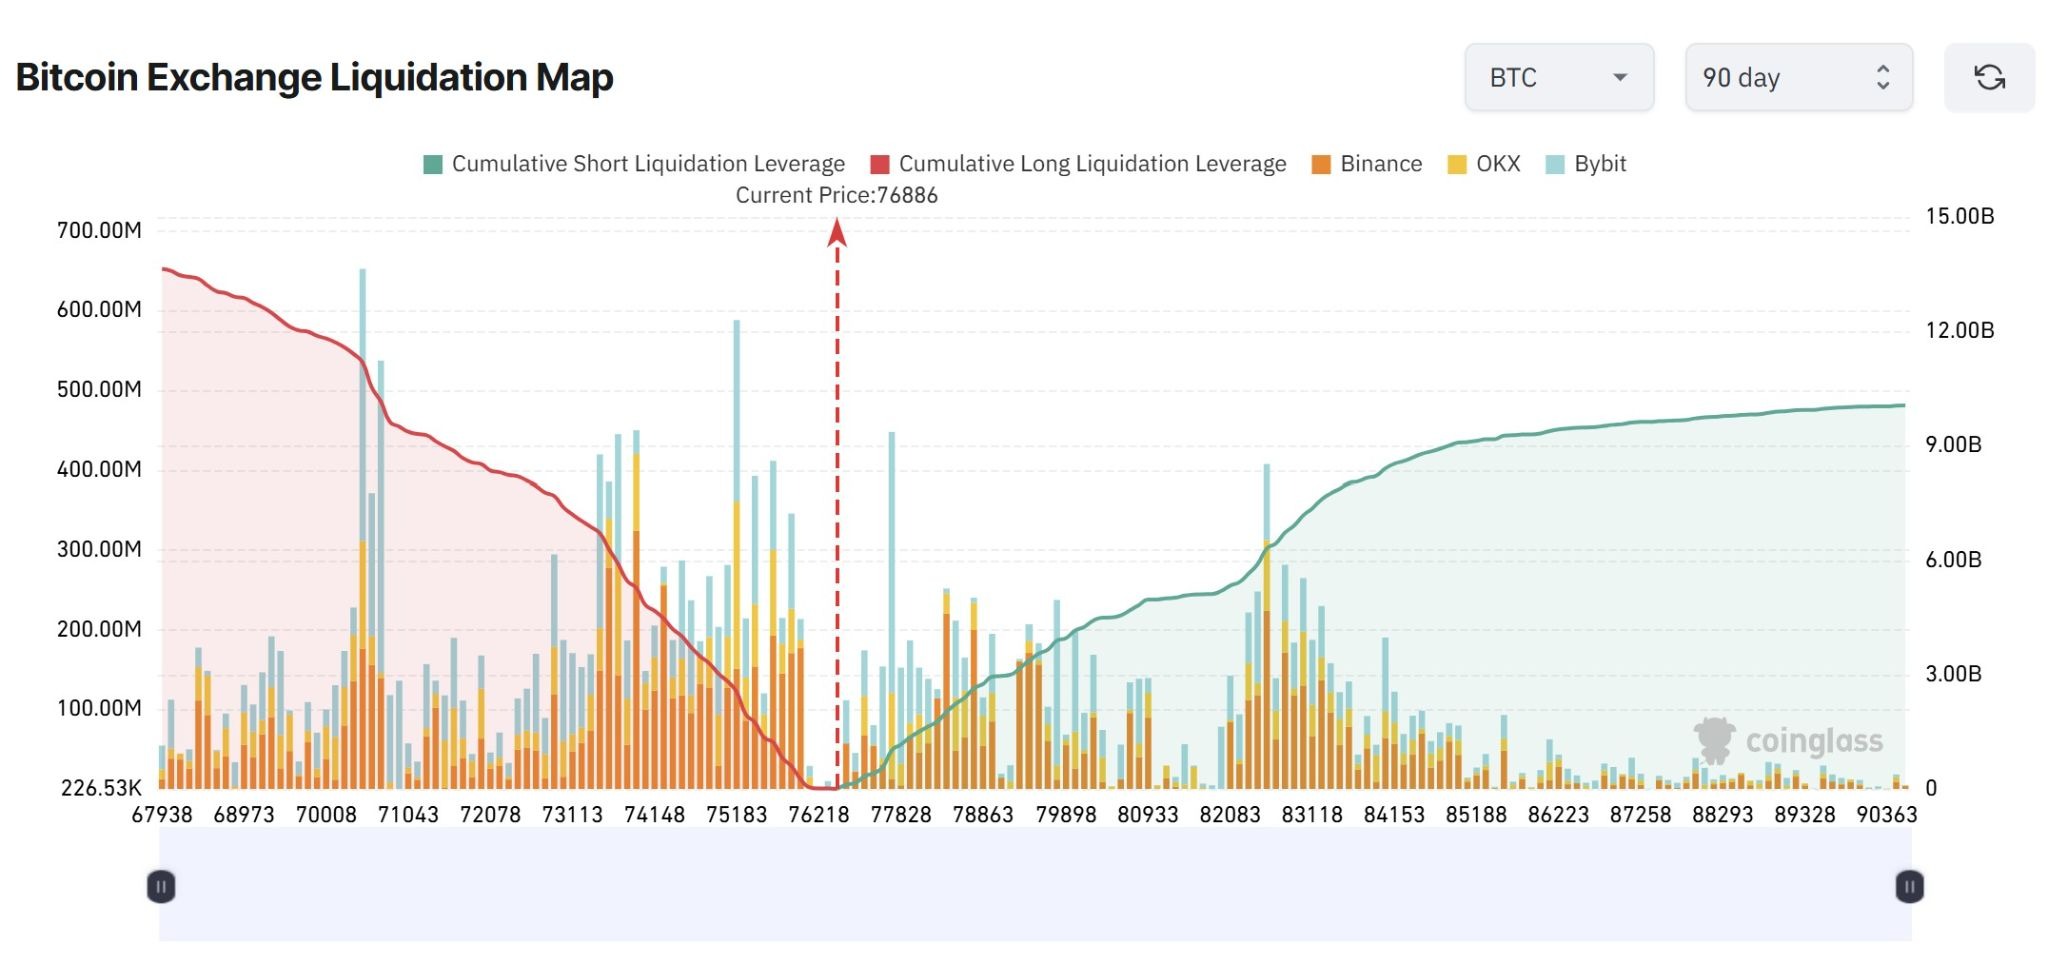
Bitcoin exchange liquidation map. Source: CoinGlass
Related: Bitcoin Price Stays Below 77,000 dollars as US bond yields are near their highest levels in 20 years
Long retail BTC positions are crowded
Crypto analytics platform Hyblock has noticed that Bitcoin retail traders are leaning towards the bulls again as the long percentage of “real retail accounts” has risen above 60%. The indicator tracks the share of retail futures accounts holding long positions.
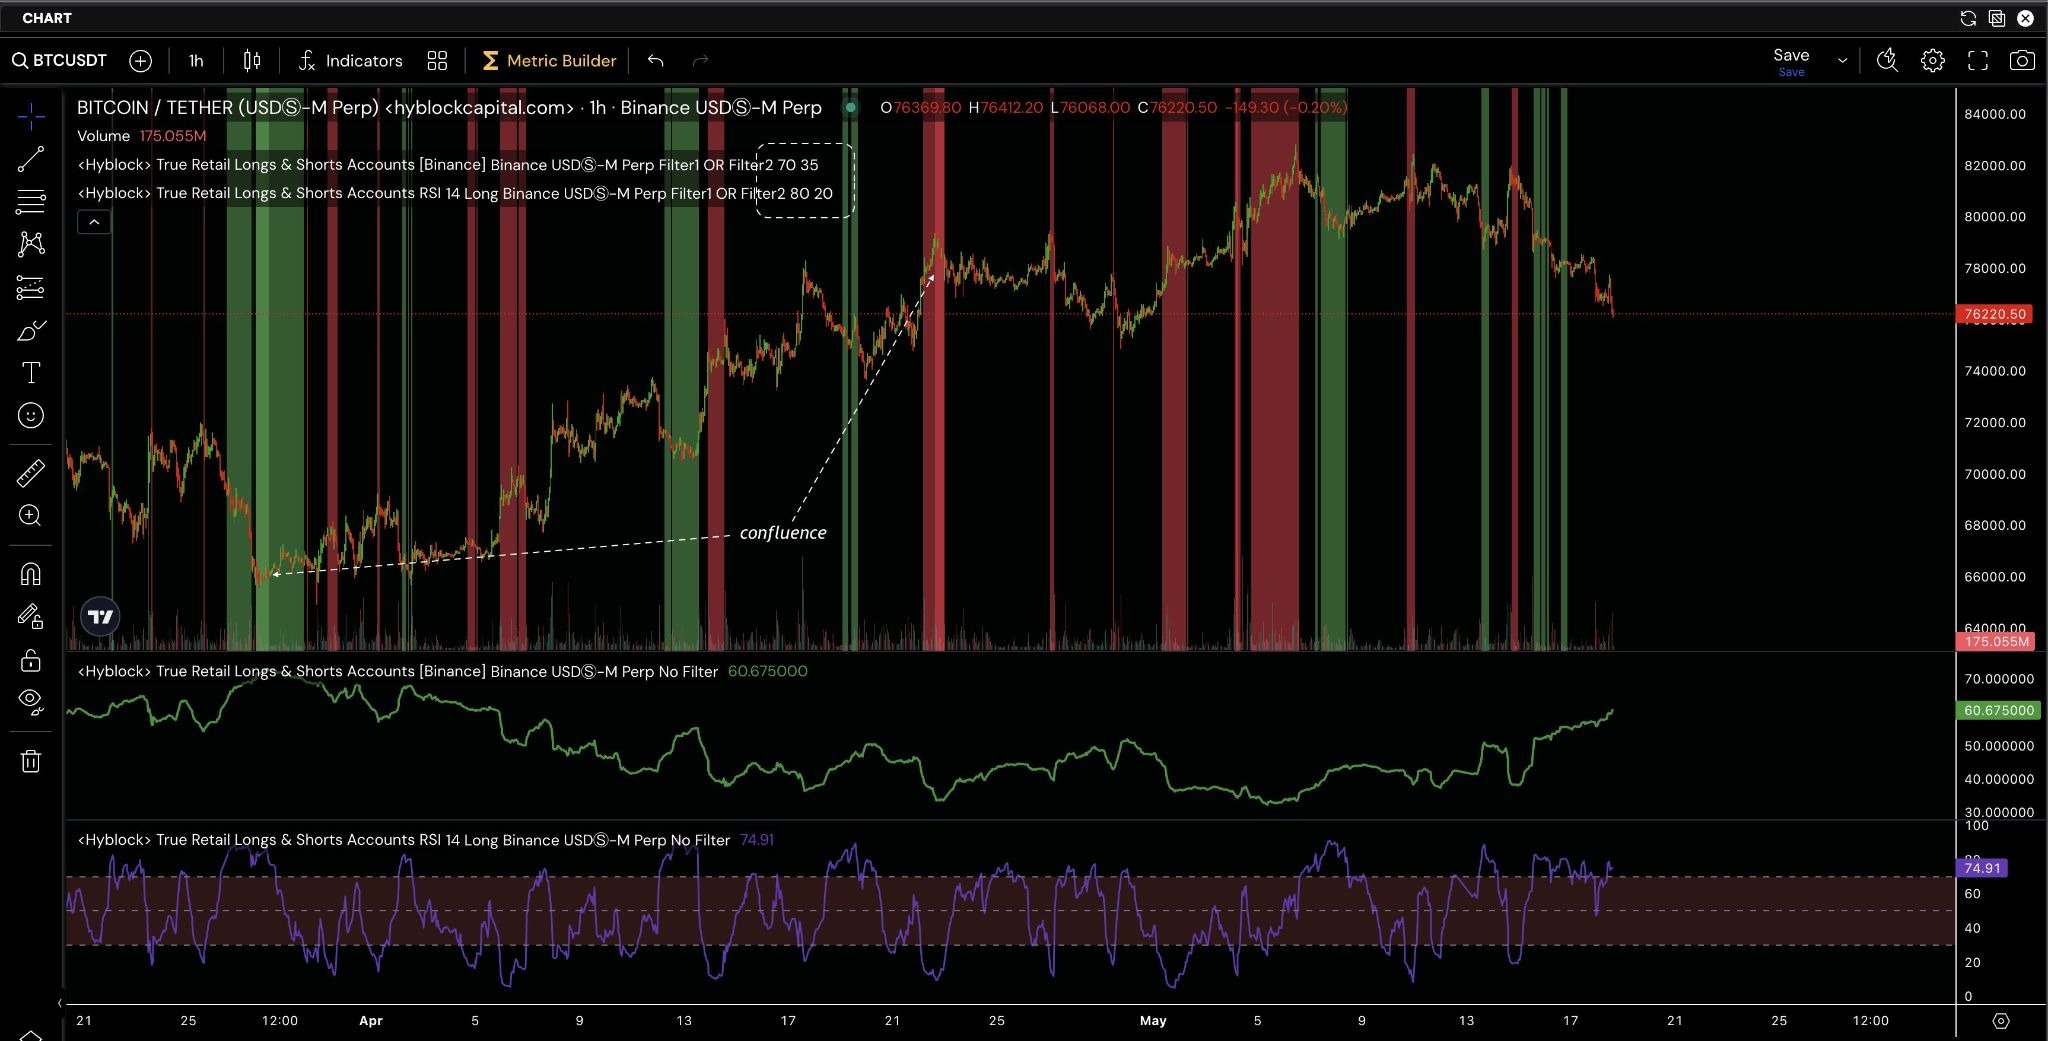
BTC/USDT, one-day chart. Source: Hyblock/X
Previous jumps into the platform’s “extreme long” zone matched short-term local highs during gains toward the $78,000-$82,000 range in early May. Price momentum later weakened as retail positioning became too crowded.
Hyblock explained that the strongest points of the recovery came when retail investors adopted an aggressive bear market. Several periods in which less than 35% of retail accounts were long occurred near Bitcoin’s lows in March and April before BTC rebounded from the mid-$60,000 range.
Hyblock combines the Retail Positioning Indicator with a 14-period Relative Strength Index (RSI) reading to identify extreme sentiment for BTC.
Latest reading can be seen TRA Long (%) near 60.7%, while RSI remained high at 74.9, suggesting retail traders are still positioned for prices near $76,000. This could lead to a deeper correction if BTC follows its previous market behavior.
Related: Bitcoin Miner Canaan Reports $88.7M Net Loss in Q1 as BTC Drops