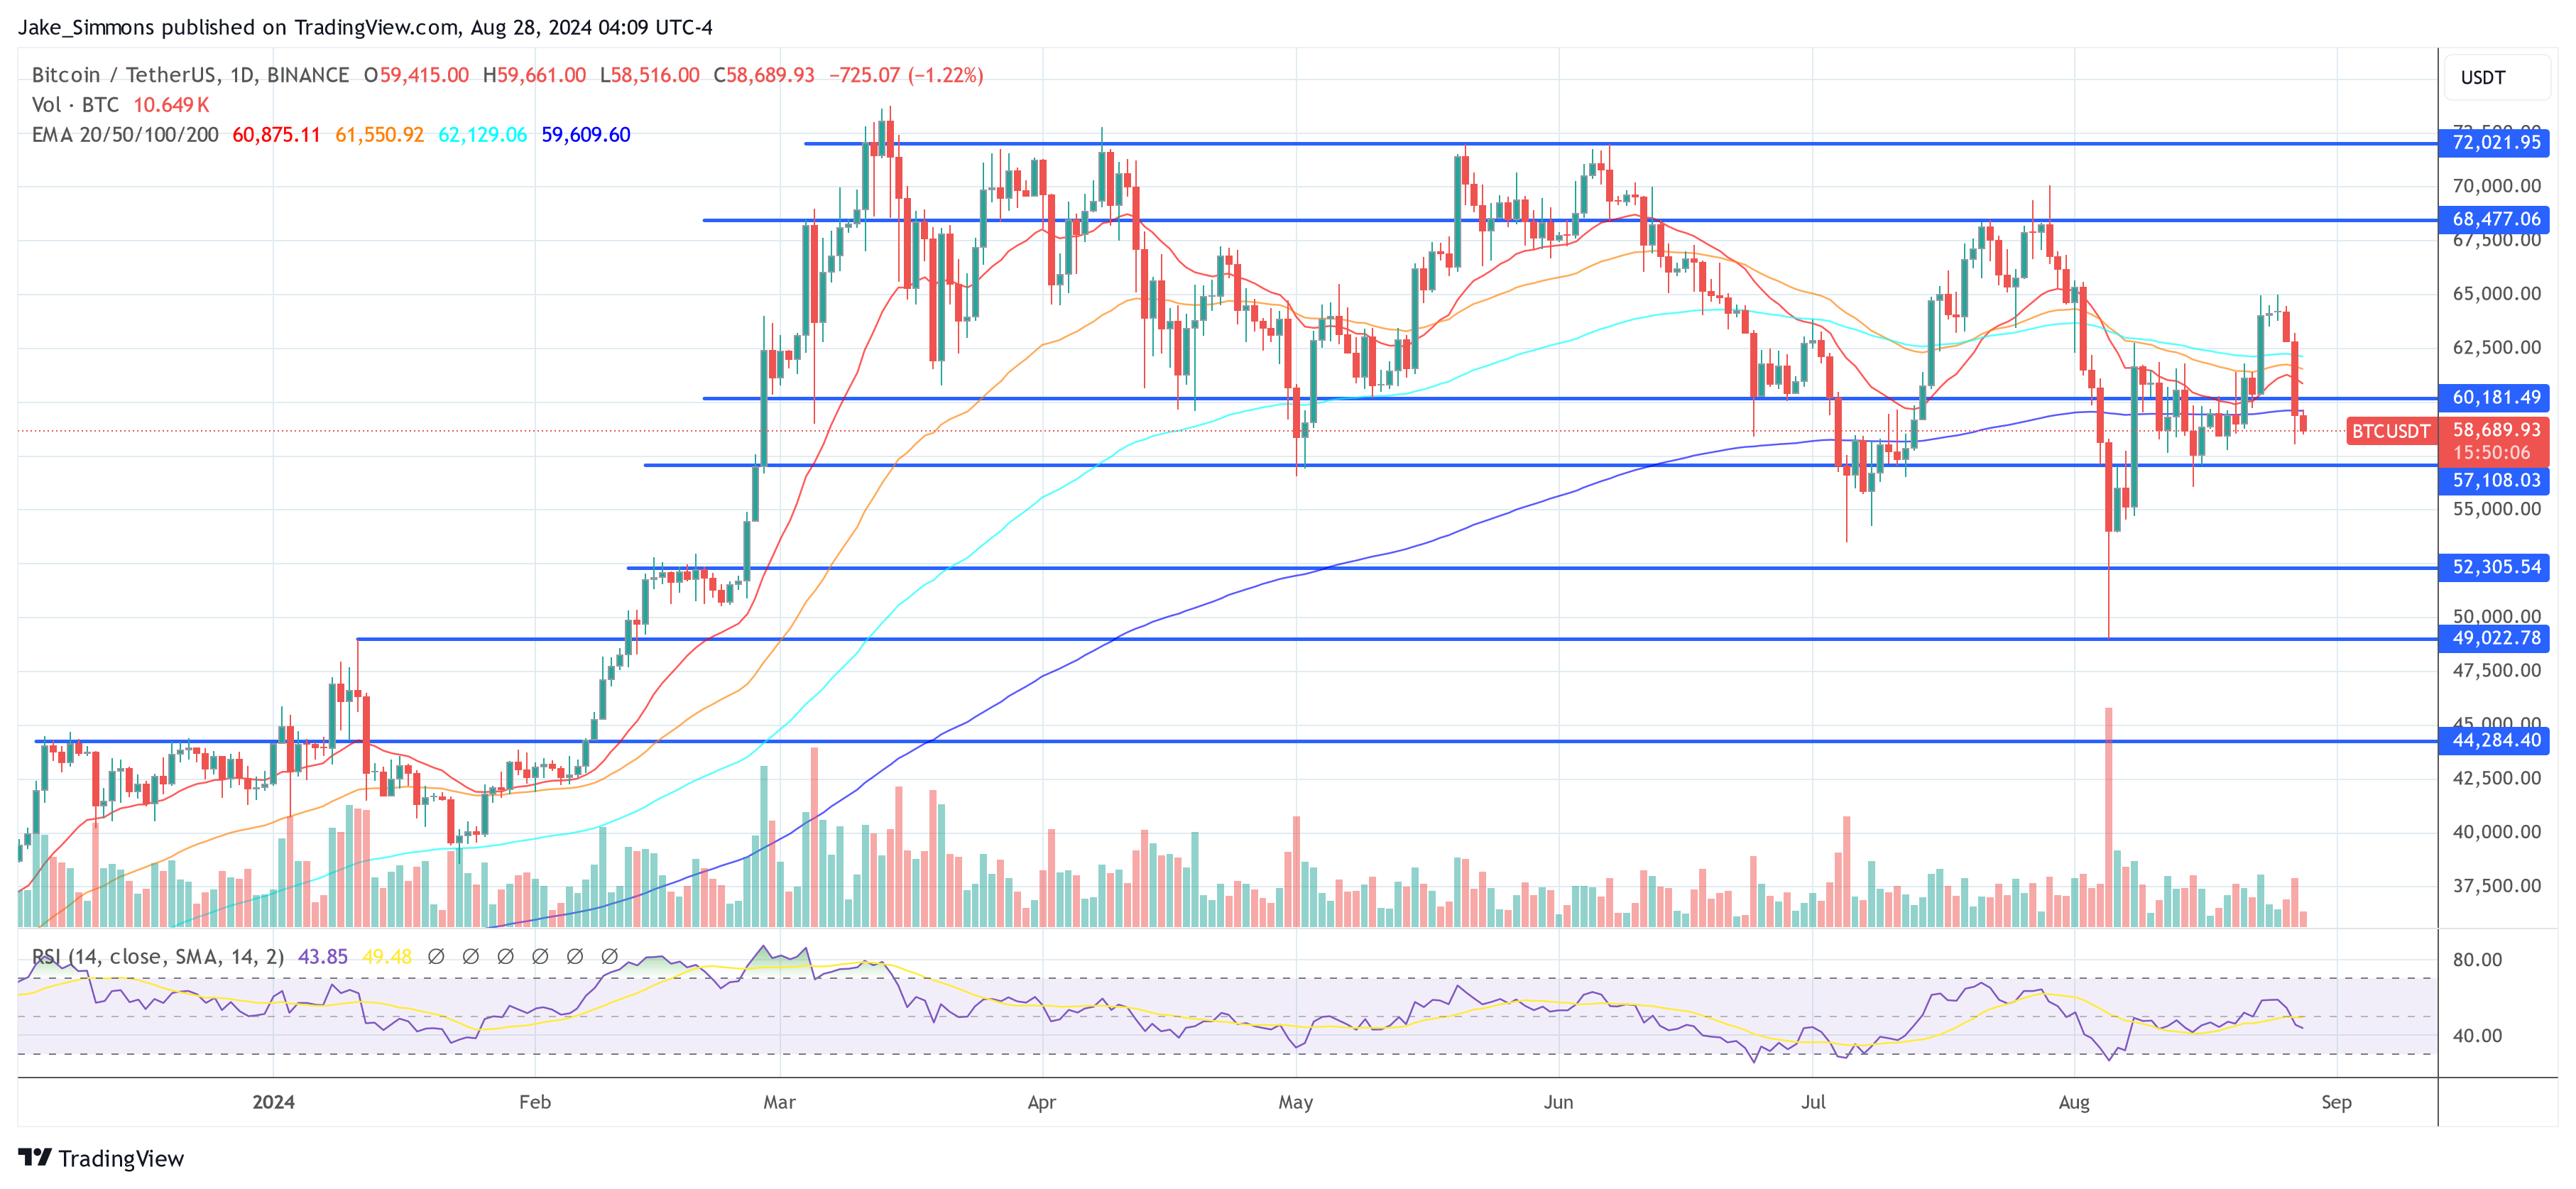
Bitcoin has been going through a consolidation phase since setting a fresh all-time high of $73,777 in mid-March. Since then, Bitcoin’s daily closing prices have shown considerable restraint, never breaking above $71,500 and maintaining a low above $54,000, although it has recorded major intraday lows of $49,000. This consolidation phase has pushed the Fear and Greed Index toward a cautious “fear” score of 30, revealing an atmosphere of concern among traders who are often unnerved by volatile market dynamics.
Is $60,000 the fresh $10,000 for bitcoin price?
Despite the market nervousness, some market experts see this as a potential buying opportunity, reminiscent of similar market conditions seen in 2019. Bloomberg ETF expert James Seyffart he noticed via X: “Bitcoin is currently trading around $50-70k over the last 6 months, which is a bit reminiscent of BTC trading around $7-10k from mid-2019 to early to mid-2020.”
He admits that comparing historical and current charts is complicated, emphasizing that while historical patterns shouldn’t dictate future outcomes, the comparative dynamics offer insightful parallels. “Of course, I know that you shouldn’t equate historical charts with current charts. I know all the differences in current price dynamics, etc. $10k was a lot further from $20k and more from the $60k ATH. But go ahead — make fun of me. I can take it,” Seyffart added.
James “Checkmate” Check, leading on-chain analyst and co-founder of Checkonchain, he agreed with Seyffart’s observation. “The similarities between the consolidation in 2024 and that which we experienced in 2019 are strange and uncanny.”
In 2019, the market rose significantly from $4,000 to $14,000 in three months, largely driven by the Chinese Ponzi scheme PlusToken, which absorbed about 2% of the total circulating supply of bitcoins at the time. This was followed by a massive sell-off of these acquired coins on Huobi by the Chinese CCP, which contributed to prolonged market volatility until the edged decline in March 2020.
Drawing a parallel, Check noted that a similar sequence of events occurred in 2024, when the market rose from $40,000 to $73,777, triggered by a significant raise in spot offers from US spot ETFs, taking up about 5% of the bitcoin supply. This was followed by significant selling actions by the US and German governments, involving about 70,000 BTC, which contributed to a sustained market decline until August 5, when the Yen Carry Trade ended.
“Seriously, it’s really weird how similar these events are, and that’s just based on the headline events. There’s even more evidence beneath the surface,” Check concluded. He shared several on-chain metrics that underscore the robust similarities.
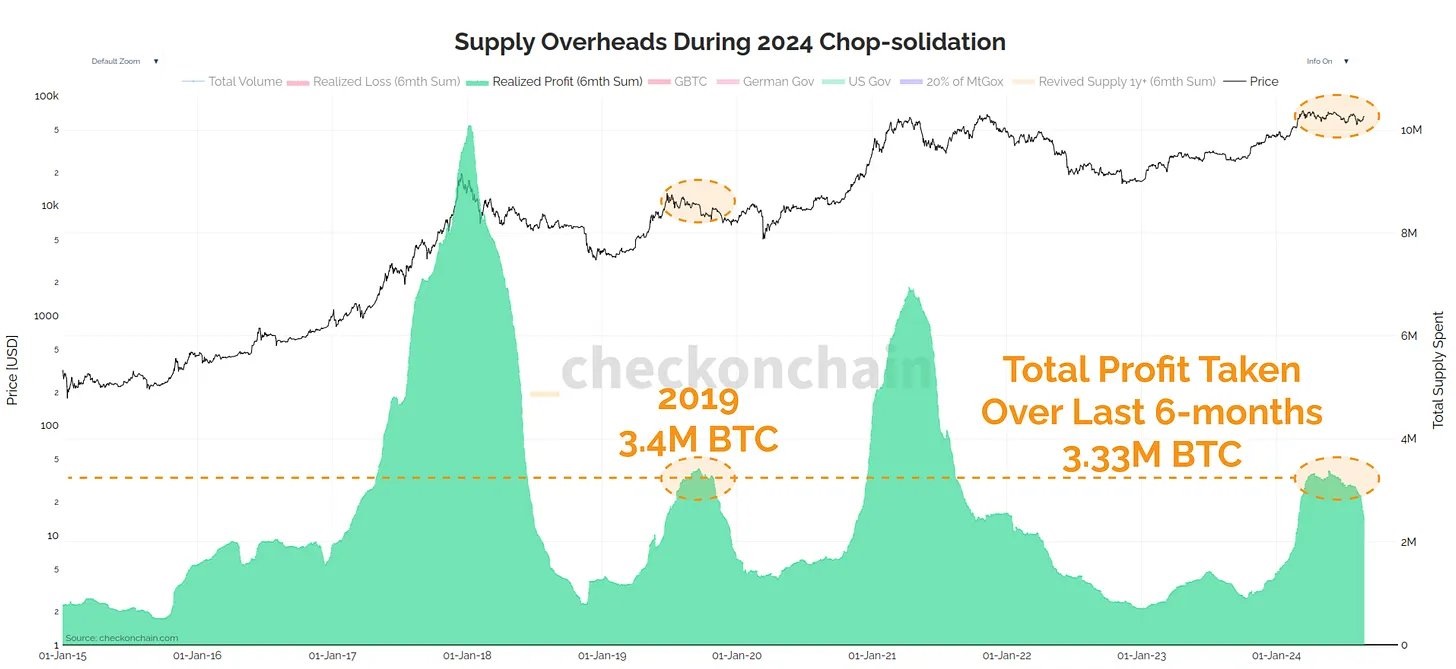
His “Supply Overheads During 2024 Chop-consolidation” chart showed that the 6-month total for coins older than 1 year was quite similar to historical movements. In 2019, this cohort moved 1.75 million BTC; by comparison, in 2024, as of today, 1.9 million BTC have been mobilized. It’s worth noting that major entities including the Grayscale Bitcoin Trust (GBTC), the German government, and the US government accounted for about 454,000 BTC of that movement.
Additional data from Check’s analysis highlighted “Realized Gains” during these periods. In 2019, 3.4 million BTC were sold to make a profit over the six-month period. In 2024, the figure is 3.33 million BTC.
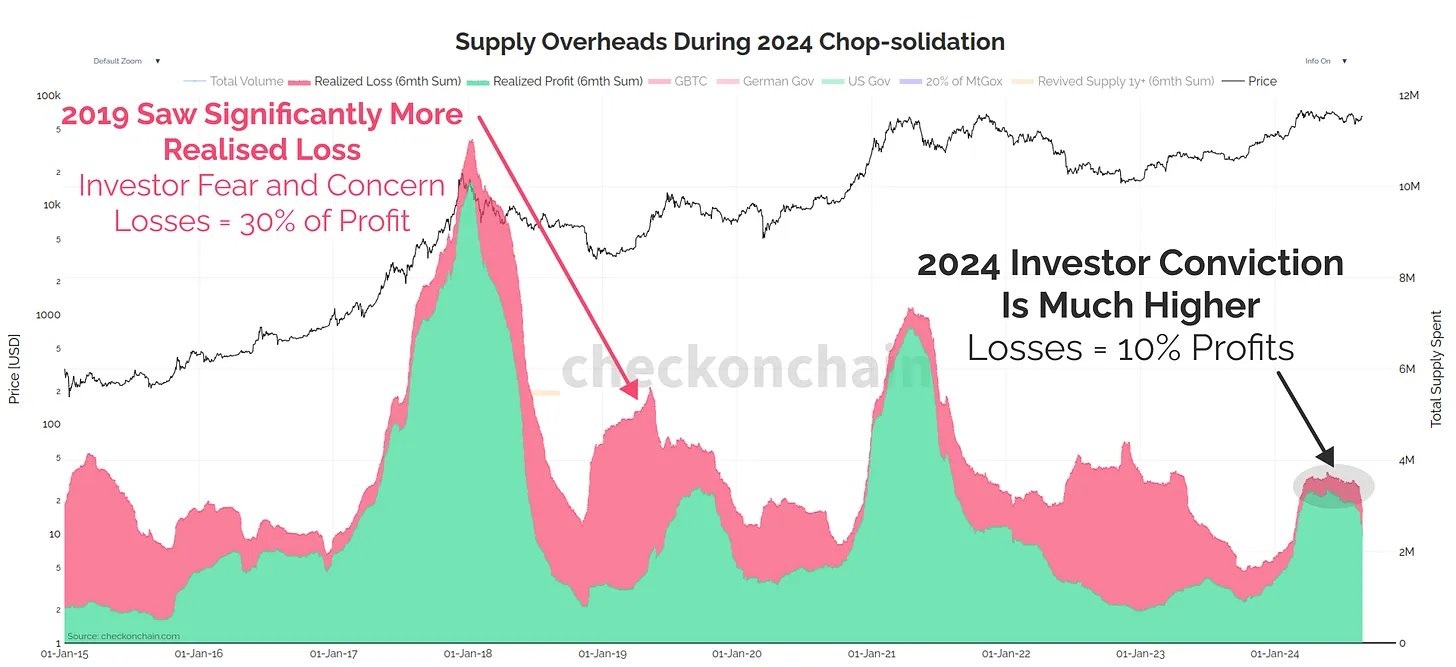
However, an analysis of realized losses shows a stark contrast between the two periods. In 2019, losses accounted for 30% of gains, indicating a market full of investor concerns and a willingness to sell on losses. In 2024, losses account for just 10% of gains. This comparison shows how market sentiment has changed from 2019 to 2024, with investors appearing more confident and less inclined to panic sell in 2024.
At the time of going to press, the BTC price was $59,689.
Featured image created with DALL.E, chart from TradingView.com