
Ethereum price today: $1,860
- Ethereum’s decline to a yearly low against Bitcoin has sparked calls for an ETH bottom that is ultimately turning into altcoin season.
- However, ETH/BTC valuation ratios have not yet reached the extreme levels that historically coincide with ETH lows.
- ETH risks falling to $1,800 if it fails to rebound from the 20- and 50-day EMAs.
According to CryptoQuant, Ethereum (ETH) is showing early signs of a market bottom against Bitcoin (BTC), but needs to confirm several other key bottom signals before outperformance can be expected.
In a report published behind schedule Thursday evening, an analyst from the on-chain analytics firm noted that Ethereum has underperformed Bitcoin for almost a year, as evidenced by the ETH/BTC ratio falling to 0.028, its lowest level since August last year.
Such conditions typically result in increased sentiment around a potential ETH bottom, which ultimately extends into the altcoin season.
“The question for investors is whether ETH is currently cheap enough to mark a sustainable bottom – a prerequisite for ETH outperformance and, historically, a broader altcoin season,” the analysts wrote.
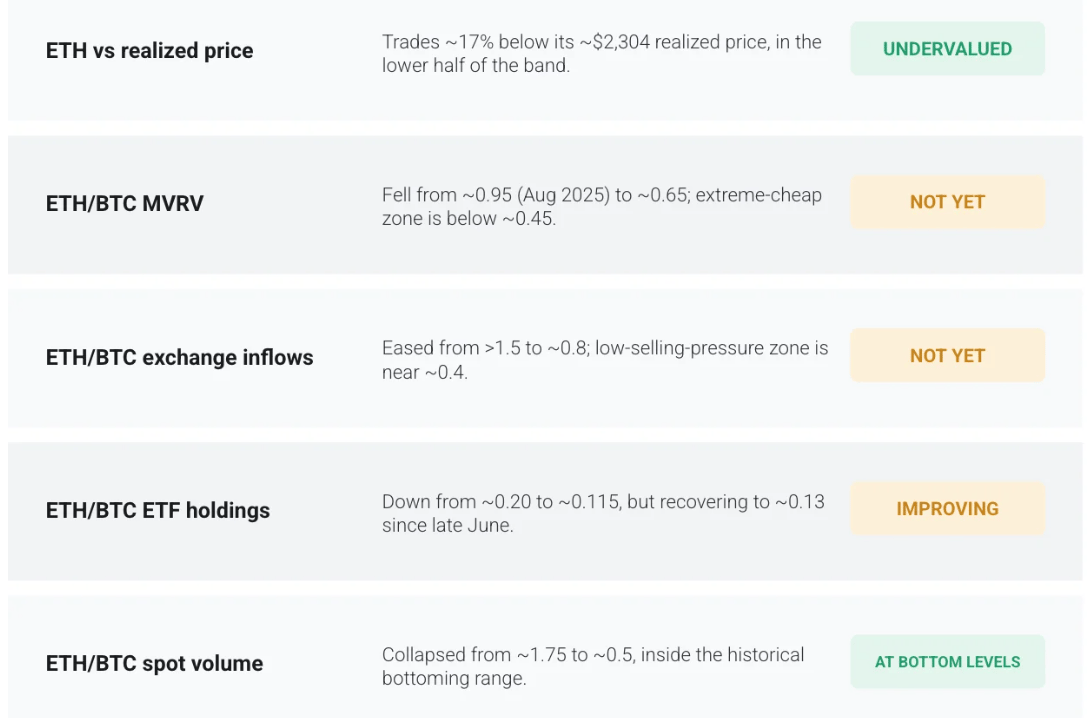
The report argued that Ethereum is closer to the bottom of the market with less risk of loss compared to upside as it is trading near $1,900, approximately 17% below the realized price or average on-chain cost of all ETH tokens, which is $2,304. The move towards $1,900 comes after ETH fell from a record high of $4,946 last year to a low of $1,400 in June.
“On a stand-alone basis, Ethereum is already cheap. Trading below the aggregate cost basis means the marginal holder is at a loss, which has historically exhausted sellers and limited losses,” CryptoQuant stated.
Analysts, however, argued that ETH has not fully emerged with low signals compared to Bitcoin based on other key on-chain data.
ETH/BTC ratios have not reached extreme levels yet
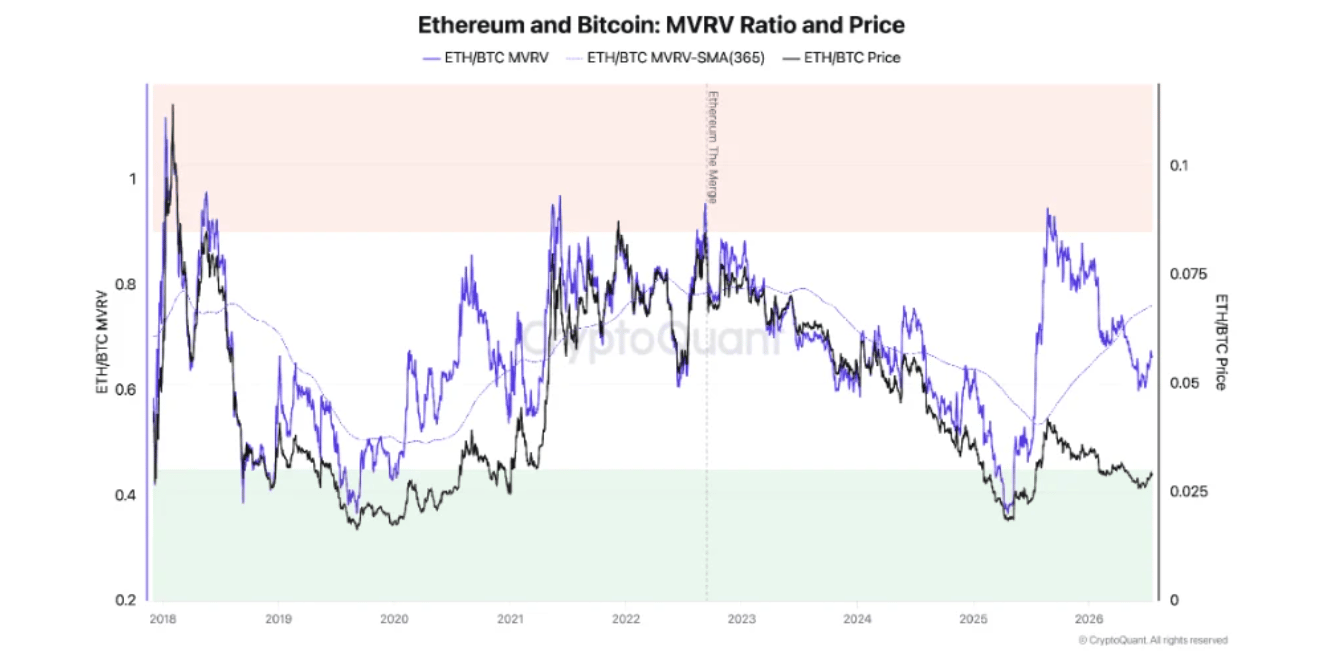
The report highlights that the ETH/BTC market value to realized value (MVRV) has dropped from 0.95 in August last year to almost 0.65, indicating a shift from overvaluation to neutral levels. CryptoQuant noted that ETH forms a “sustainable bottom” when the indicator drops below 0.45, as it did in 2019-2020 and early 2025.
A similar trend is evident in ETH/BTC exchange inflows, which have dropped to 0.8 after peaking above 1.5 in August, indicating a decline in the amount of ETH relative to Bitcoin being sent to exchanges. Analysts argued that lows often form when the ratio falls to 0.4.
Moreover, shares in ETH/BTC funds (ETFs) show that institutional allocators have been returning to Ethereum since the end of June, after months of destitute performance. The indicator saw a moderate escalate to 0.13 in July, after falling from a high of 0.205 in August/September 2025 to 0.115 in June.
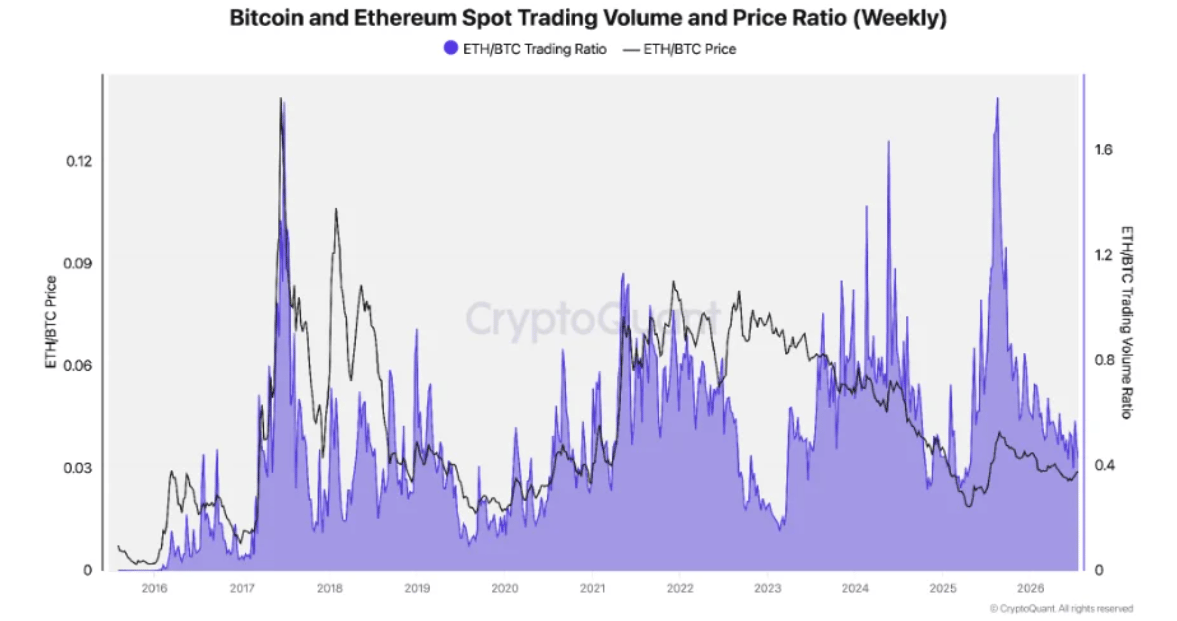
While these metrics have yet to confirm a bottom, ETH/BTC relative spot volume is an outlier. This ratio dropped sharply from 1.75 in August to around 0.5, which has historically coincided with ETH price lows.
“[ETH] is already cheap compared to cost price, the relative selling pressure has halved. Demand for ETFs has begun to reverse and trading activity remains at levels that marked previous lows. However, MVRV and exchange inflows have not yet reached the extremes that have confirmed the bottom in the past – so the eventual bottom and ETH outperformance that follows may still take longer to form,” CryptoQuant analysts concluded.
At the beginning of the week FXStreet reported that ETH’s recent recovery follows the trigger of the MVRV buy signal, which has also coincided with the most popular altcoin’s price lows in the past.
Ethereum Price Forecast: ETH Risks Further Fall If It Falls Below the 20- and 50-Day EMAs
Ethereum recorded $67.79 million worth of liquidations in the last 24 hours, of which $44.18 million were long liquidations.
On the daily chart, ETH risks reverting to a bearish structure by testing the 20- and 50-day exponential moving averages (EMAs) at $1,839 and $1,831 respectively. Momentum indicators point to a decline in buying pressure, with the 14-day Relative Strength Index (RSI) and Stochastic Oscillator (Stoch) falling to 54 and 53, respectively.
On the positive side, there is initial resistance at the horizontal barrier around $1,909, ahead of the 100-day EMA at $1,936 and the $2,019 zone, where earlier supply appeared. Further north, additional limits are located at $2,108 and $2,211, with more distant resistance centered near $2,389 and $2,746.
On the downside, there is immediate support from the 20- and 50-day EMAs followed by the recent structural low near $1,806. A break below would expose the next key supports around $1,741 and then $1,524.
(The technical analysis for this story was written with the facilitate of an AI tool. Find out more.)
