The market has seen a dramatic decline in the price of Bitcoin over the past two days, from a high of $64,500 on Sunday to a low of $58,474. Yesterday’s piercing decline followed an unexpected announcement by the manager of the now-defunct Mt.Gox exchange, revealing plans to start BTC and BCH withdrawals in early July – which caused a wave of shock in the market.
This news raises urgent questions about the near future of Bitcoin’s price trajectory. Amid this market turmoil, several prominent cryptocurrency analysts have shared their observations on whether Bitcoin could approach a local bottom. Here’s a deeper dive into their analysis and perspectives:
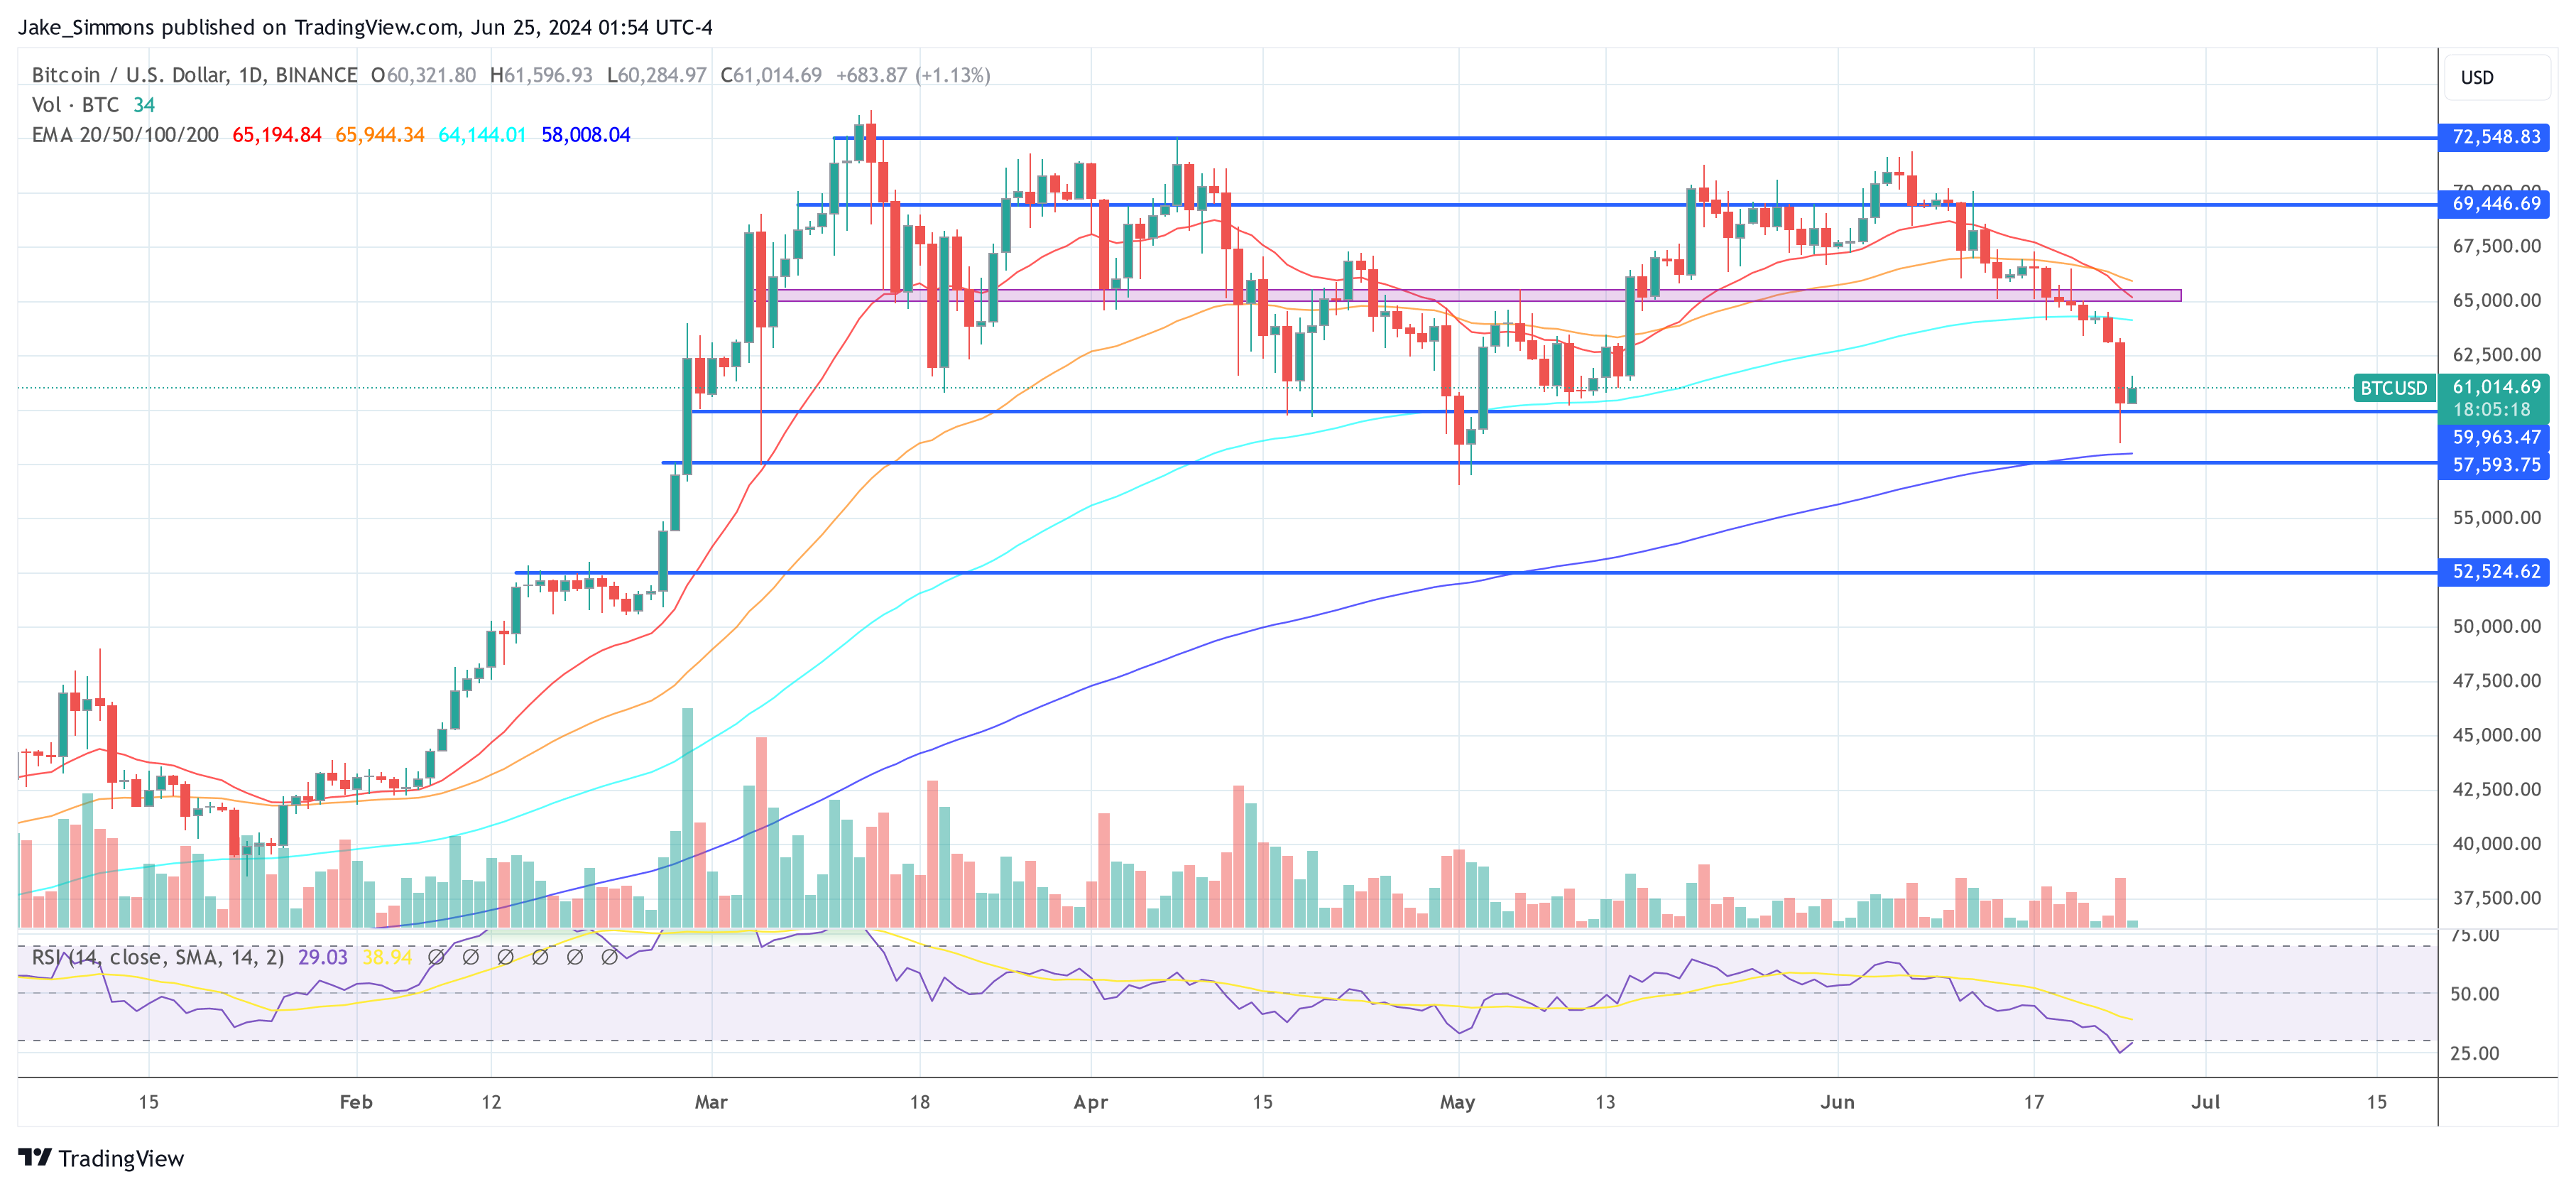
Bitcoin technical analysis
Tony “The Bull” Severino, Chief Analyst at NewsBTC, only if technical review of the current situation. Using the relative strength index (RSI), a momentum oscillator that measures the speed and change of price movements, Severino noted that RSI levels are as oversold now as they were during the FTX crash, suggesting a potential cyclical bottom.
“Bitcoin’s daily RSI is as oversold as it was during the FTX crash, indicating that a cyclical bottom may be forming,” Severino said. This analysis shows that in the past, such levels often preceded a rebound or at least stabilization in prices.
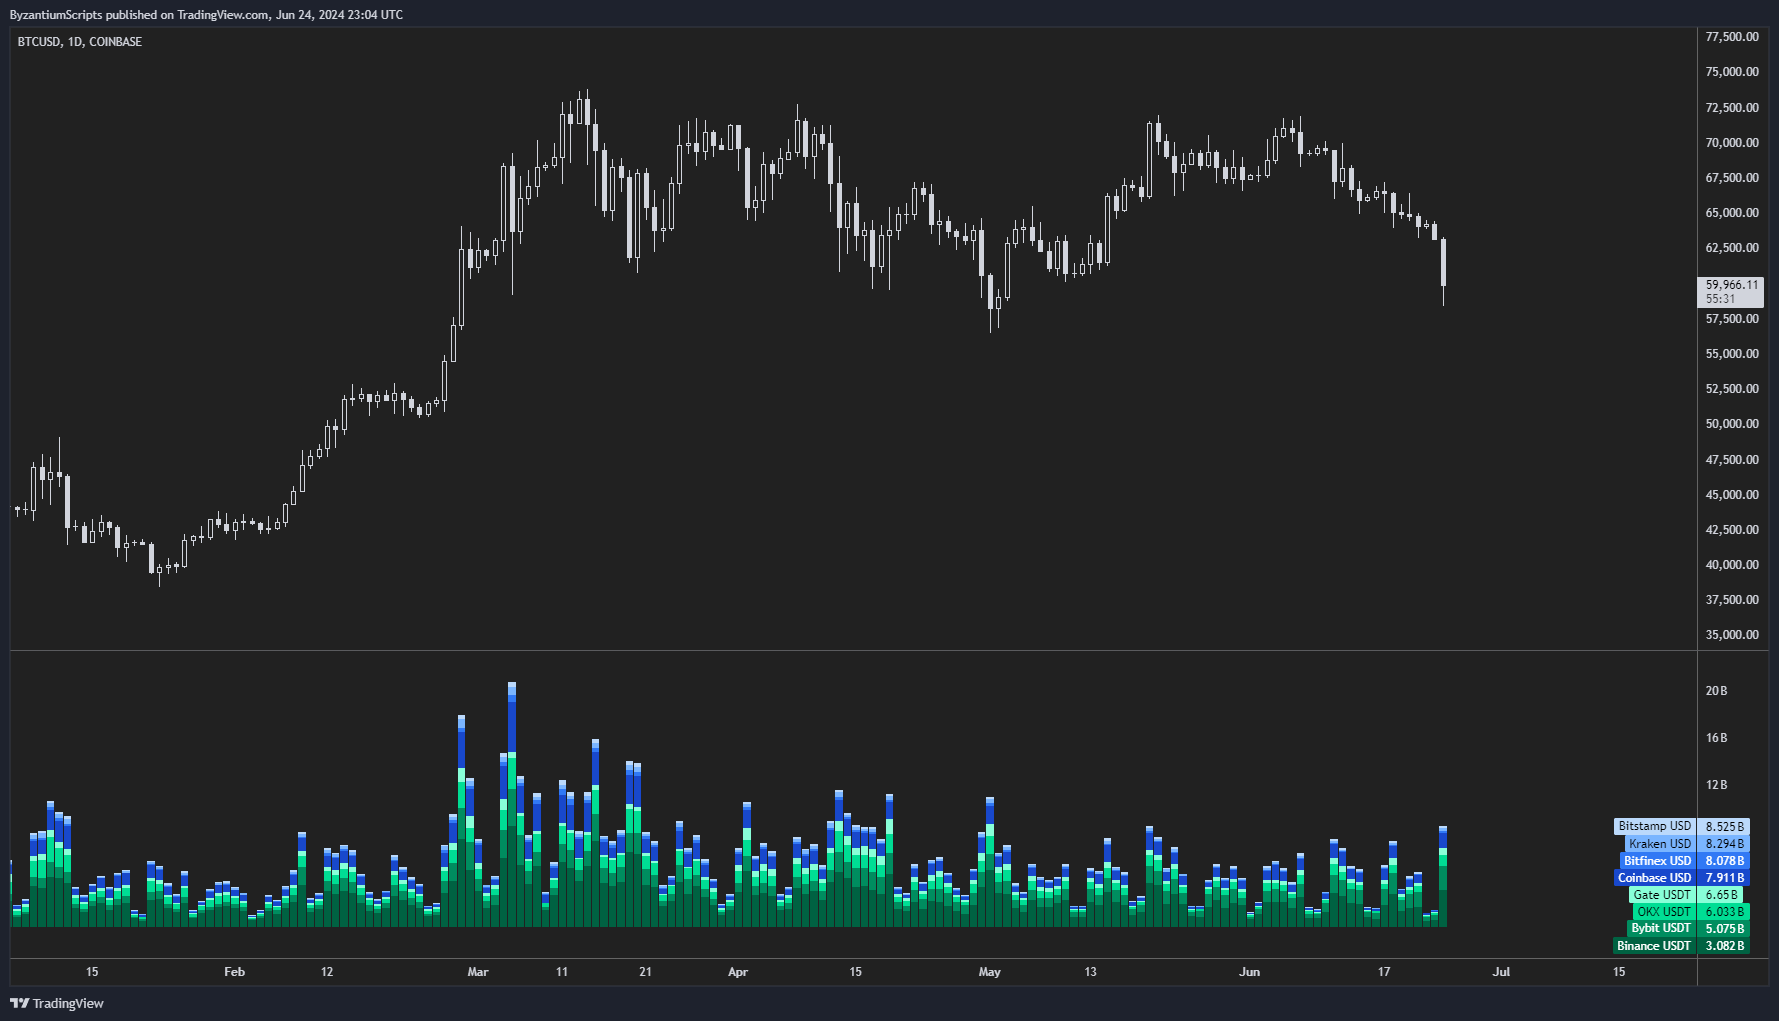
Volume and market behavior
Byzantine general, trader and market strategist, recorded unusually high spot transaction volume accompanying the price decline. “We are seeing significantly high spot volume, which may have signaled a local bottom in the past,” he noted. High trading volumes during a price decline can indicate panic, which often fizzles out, leading to a potential recovery.
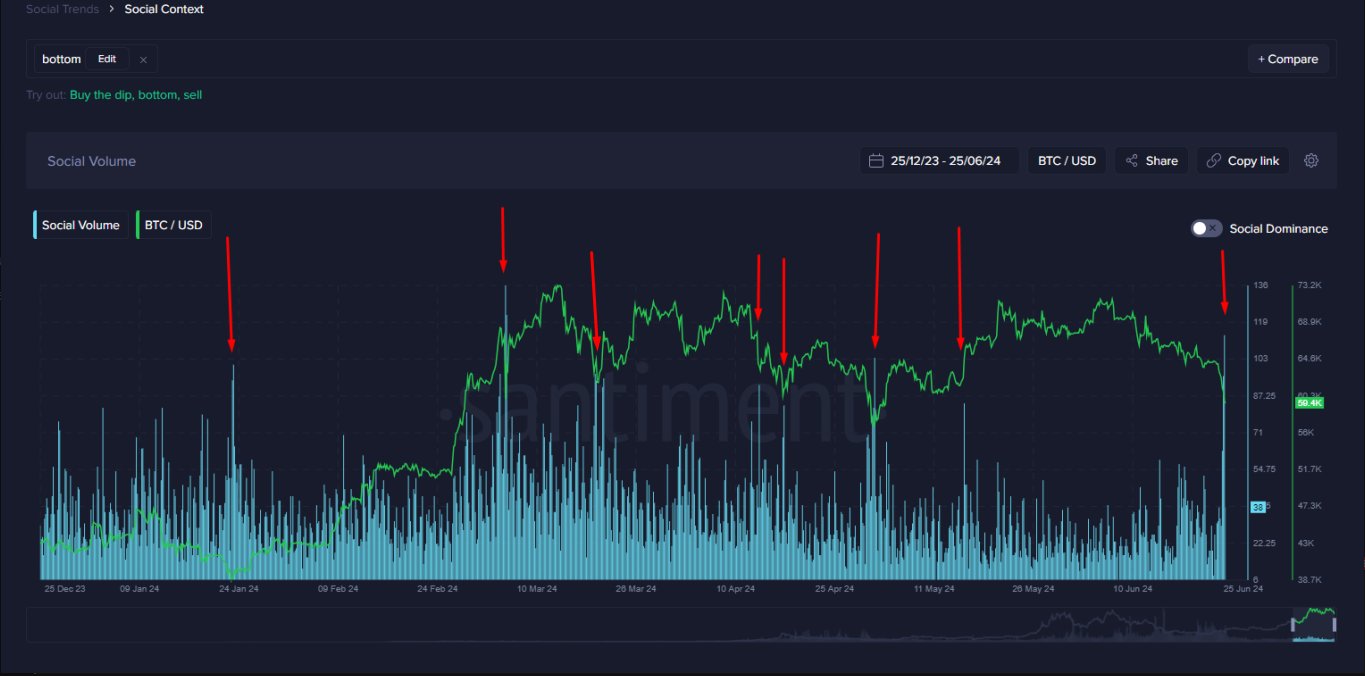
Social media sentiment
Santiment, an analytics platform focused on social metrics, has seen a surge in discussion around the term “bottom” across various social media platforms. “This is one of the highest increases in social volume and the dominance of the word ‘bottom’ that we have seen last year,” they say. Historically, such spikes can indicate increased market interest, which may correlate with key market movements.
Historical patterns and technical indicators
Cryptocurrency trader Teddy (@TeddyCleps) highlighted the importance of historical patterns and specific technical indicators such as the 21-week exponential moving average (EMA). “Historically, each correction in the BTC bull market touched the 21-week EMA and then rebounded. We are getting closer to this indicator; If history is any guide, bottom could be 61k. dollars,” Teddy explained. The 21-week EMA is a key technical level watched by many traders for signs of long-term trend support.
On-chain data analysis
James Check (@Checkmatey), an on-chain data scientist, shared his approach focusing more on capturing value rather than precise timing: “My strategy is not to identify an absolute bottom, but to acquire Bitcoin at significant discounts, as he points out – chain metrics such as STH-SOPR and STH-MVRV are both below 1.” These indicators suggest that short-term holders are selling at a loss, which could be an opportunistic entry point for long-term investors.
I prefer to acquire sats when both STH-SOPR and STH-MVRV are below 1.
I’m not looking for pants, I’m looking for reasonable discounts.
I love seeing this.#Bitcoin pic.twitter.com/Jou9TSH3A9
— _Szachmat 🟠🔑⚡☢️🛢️ (@_Szachmat_) June 25, 2024
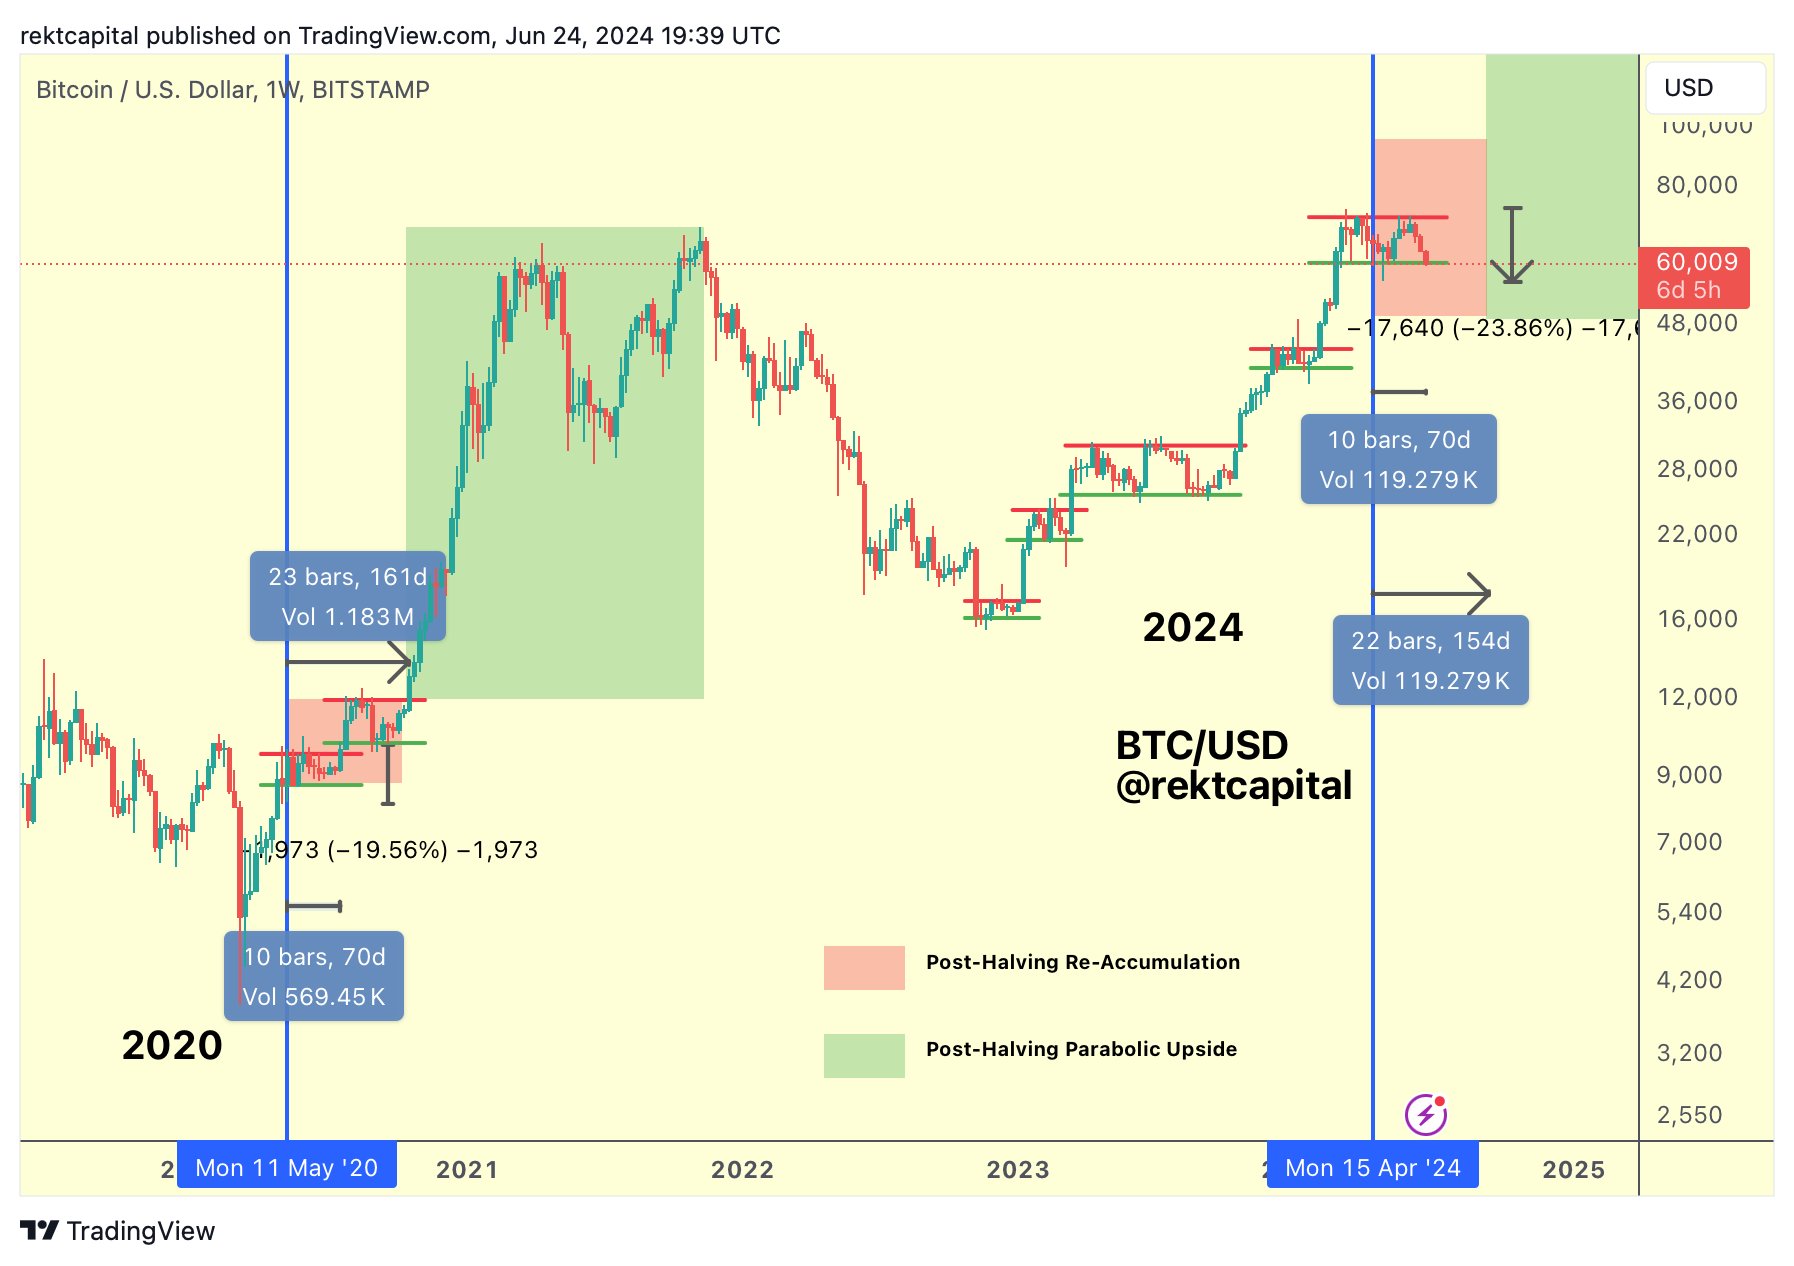
Historical results after halving
Rekt Capital (@rektcapital) analyzed Bitcoin’s performance in post-halving periods, referring to the event where Bitcoin mining rewards are halved, theoretically increasing its scarcity. “BTC did not break the high or lose the low of its ReAccumulation Range in any post-halving period. “This historical precedent suggests that Bitcoin should maintain these levels,” he outlined.
Market psychology
Cred (@CryptoCred), another respected trader, offered a different point of view and is not convinced that the bottom has already occurred: “If this is a BTC bottom, I will probably overlook it. Often, a market that fails to break at a given level and then returns and closes below it is indicative of a more legitimate break. I don’t low trade, but I don’t buy either.
At the time of publication, the price of BTC was $61,014.
Featured image created with DALL·E, chart from TradingView.com