Bitcoin (BTC) pared intraday losses and rose about 2.5% to $62,410 in the immediate aftermath of the U.S. inflation report, even as the headline consumer price index (CPI) rose to its highest level in more than three years.
BTC/USD Hourly Chart. Source: TradingView
Key takeaways:
- Bitcoin rose as the latest US CPI reading was in line with economists’ expectations.
- BTC continues to face near-term downside risk as it trades below robust resistance levels.
May inflation in the US was in line with expectations
In May, the US CPI increased by 4.2% year over year. On a monthly basis, headline inflation increased by 0.5%, while core inflation, excluding food and energy prices, increased by 2.9% annually and 0.2% month-on-month.
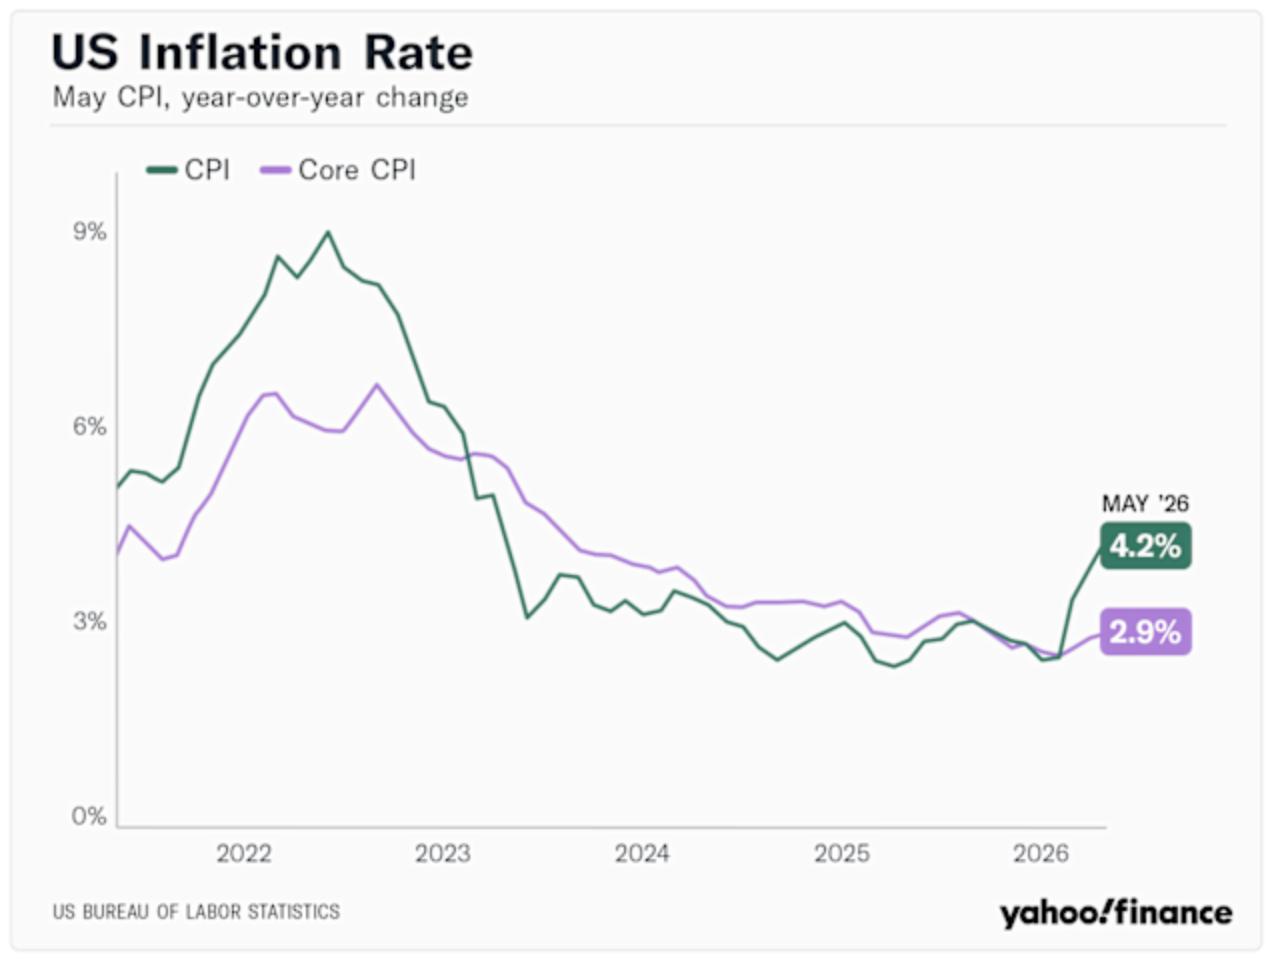
US headline and core CPI. Source: Bureau of Labor Statistics/Yahoo Finance
The main jump was mainly due to higher energy and gasoline prices as renewed tensions in the Middle East pushed up oil prices and reignited inflation concerns.
At first glance, the report looked bearish for Bitcoin. Higher inflation tends to reduce the risk of the Federal Reserve cutting interest rates, keeps Treasury yields high and tightens financial conditions. This tends to put pressure on risky assets, including cryptocurrencies.
However, BTC gained in value as the inflation reading turned out to be no worse than feared.
Economists have already done this expected headline CPI will reach 4.2%. The actual number was in line with the forecast, eliminating the risk of a stronger surprise.
Traders didn’t see the report as robust enough to force the Fed to tighten its stance, which would give them room to buy risky assets again.
This gave Bitcoin a chance to bounce off long-term support zones, including the 200-week exponential moving average (200-week EMA, blue line) and the psychological low price area of $60,000-$62,000, as shown below.
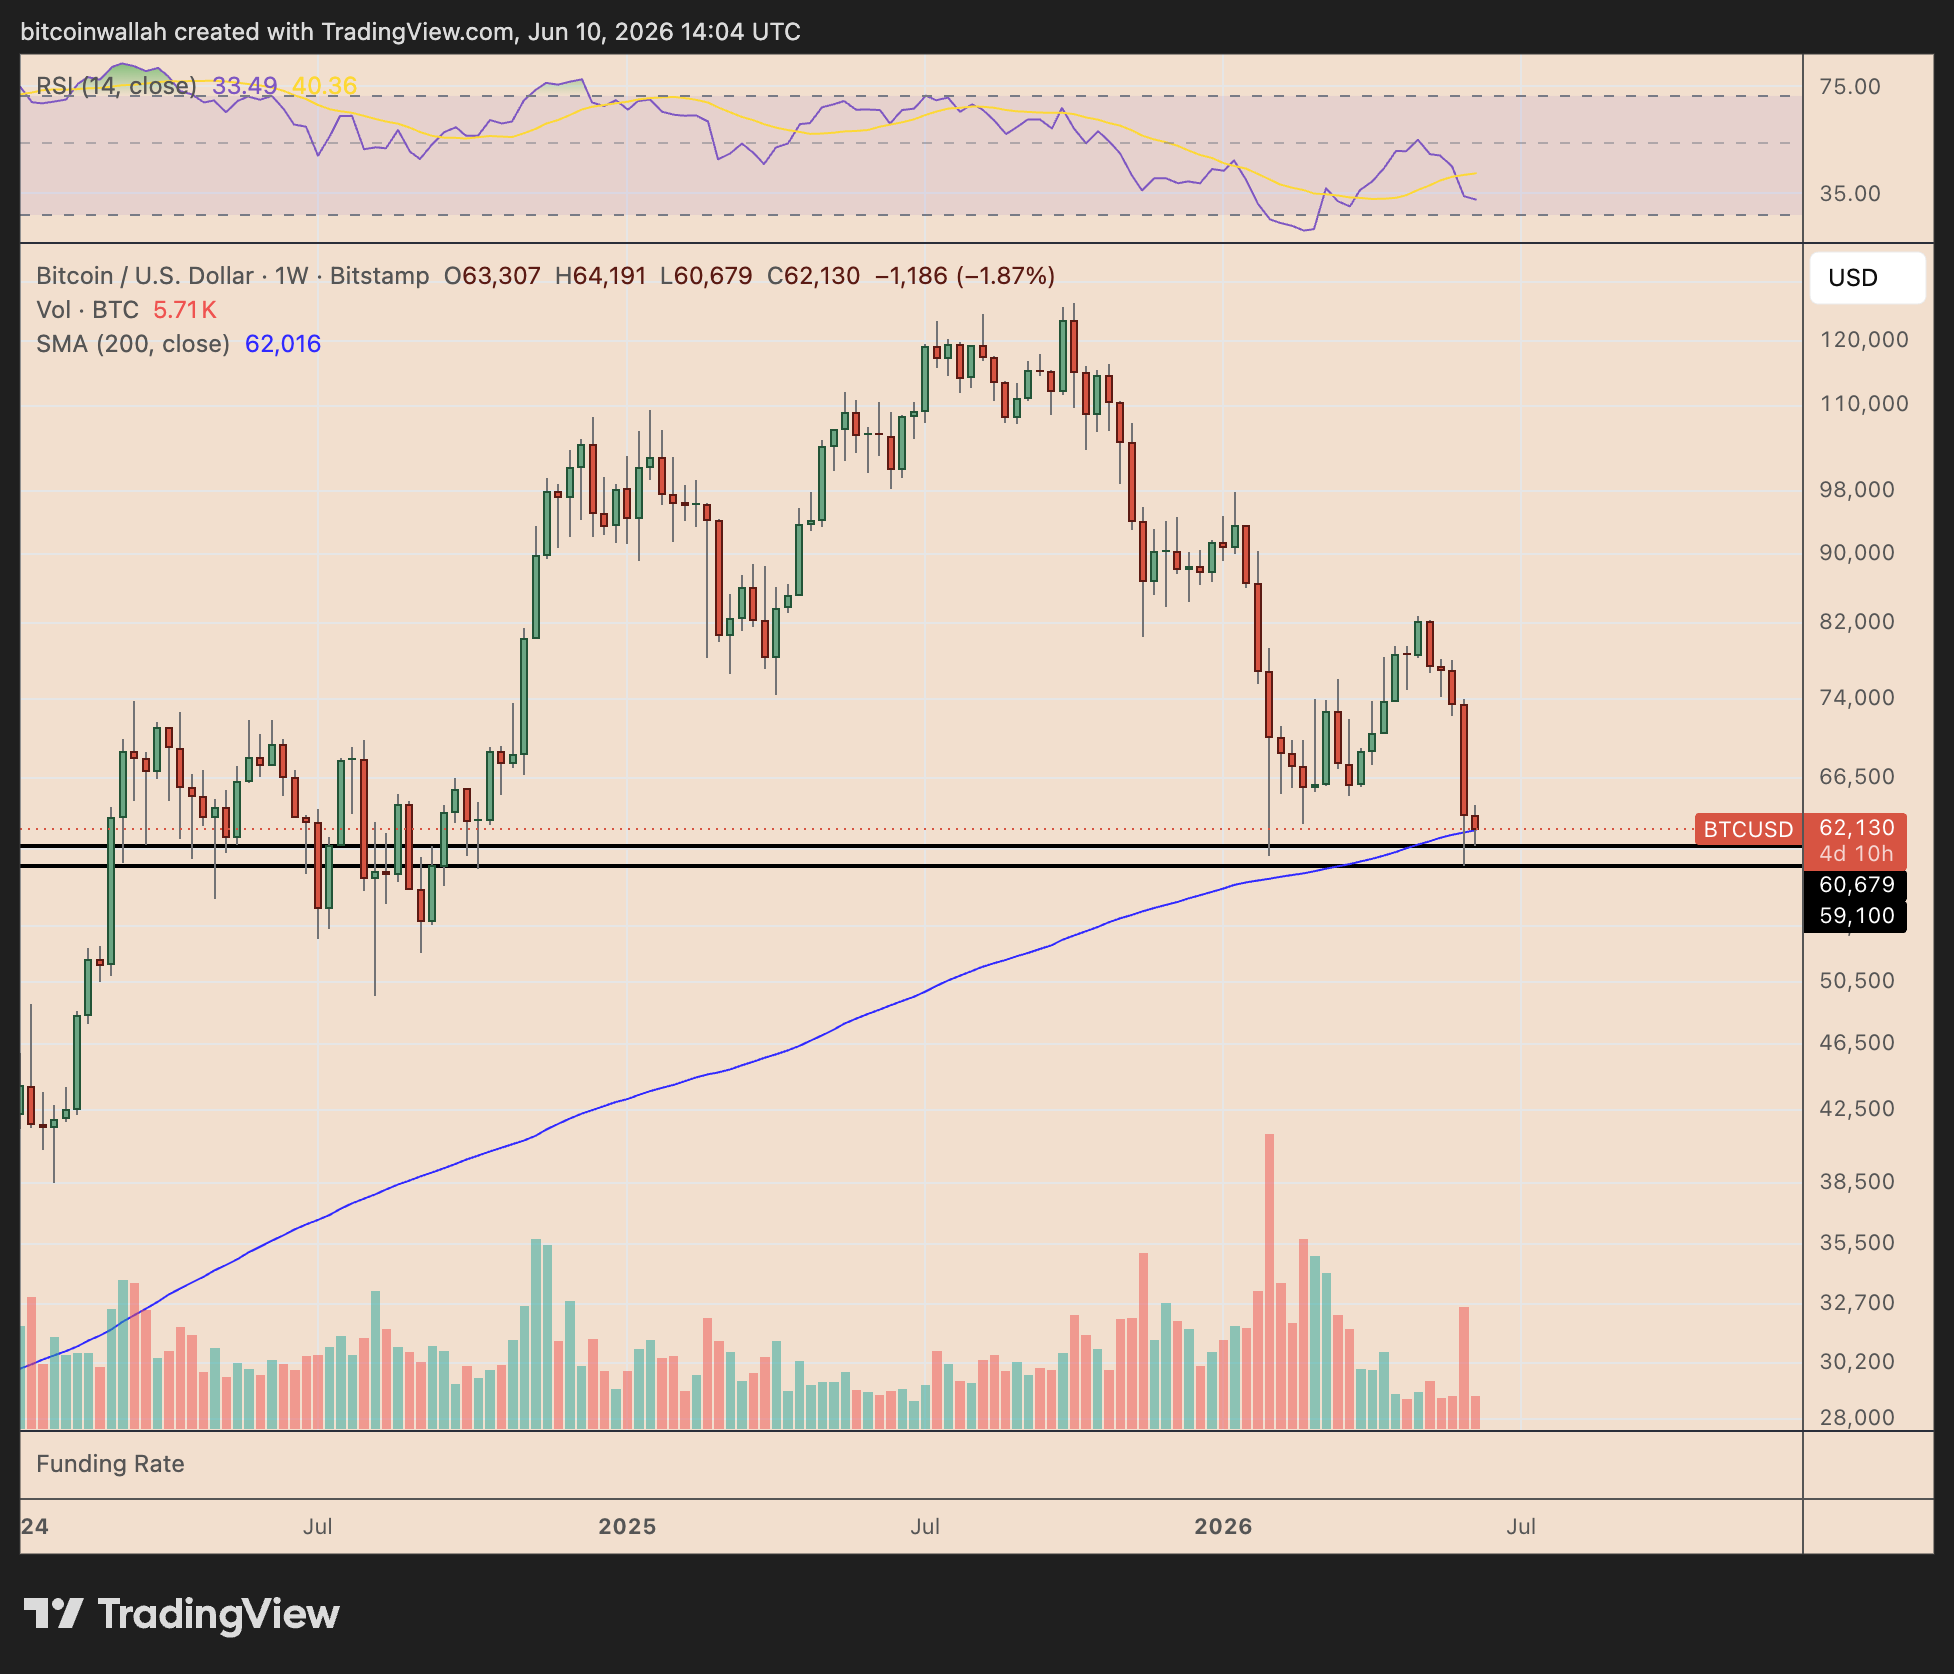
BTC/USD weekly chart. Source: TradingView
Is Bitcoin undergoing a bullish retreat?
Bitcoin’s rebound on the CPI does not yet confirm a full bullish reversal.
From a technical perspective, BTC continues to trade below key near-term resistance levels, including the 20-period SMA marked in green and the 50-period SMA marked in red on the four-hour chart.
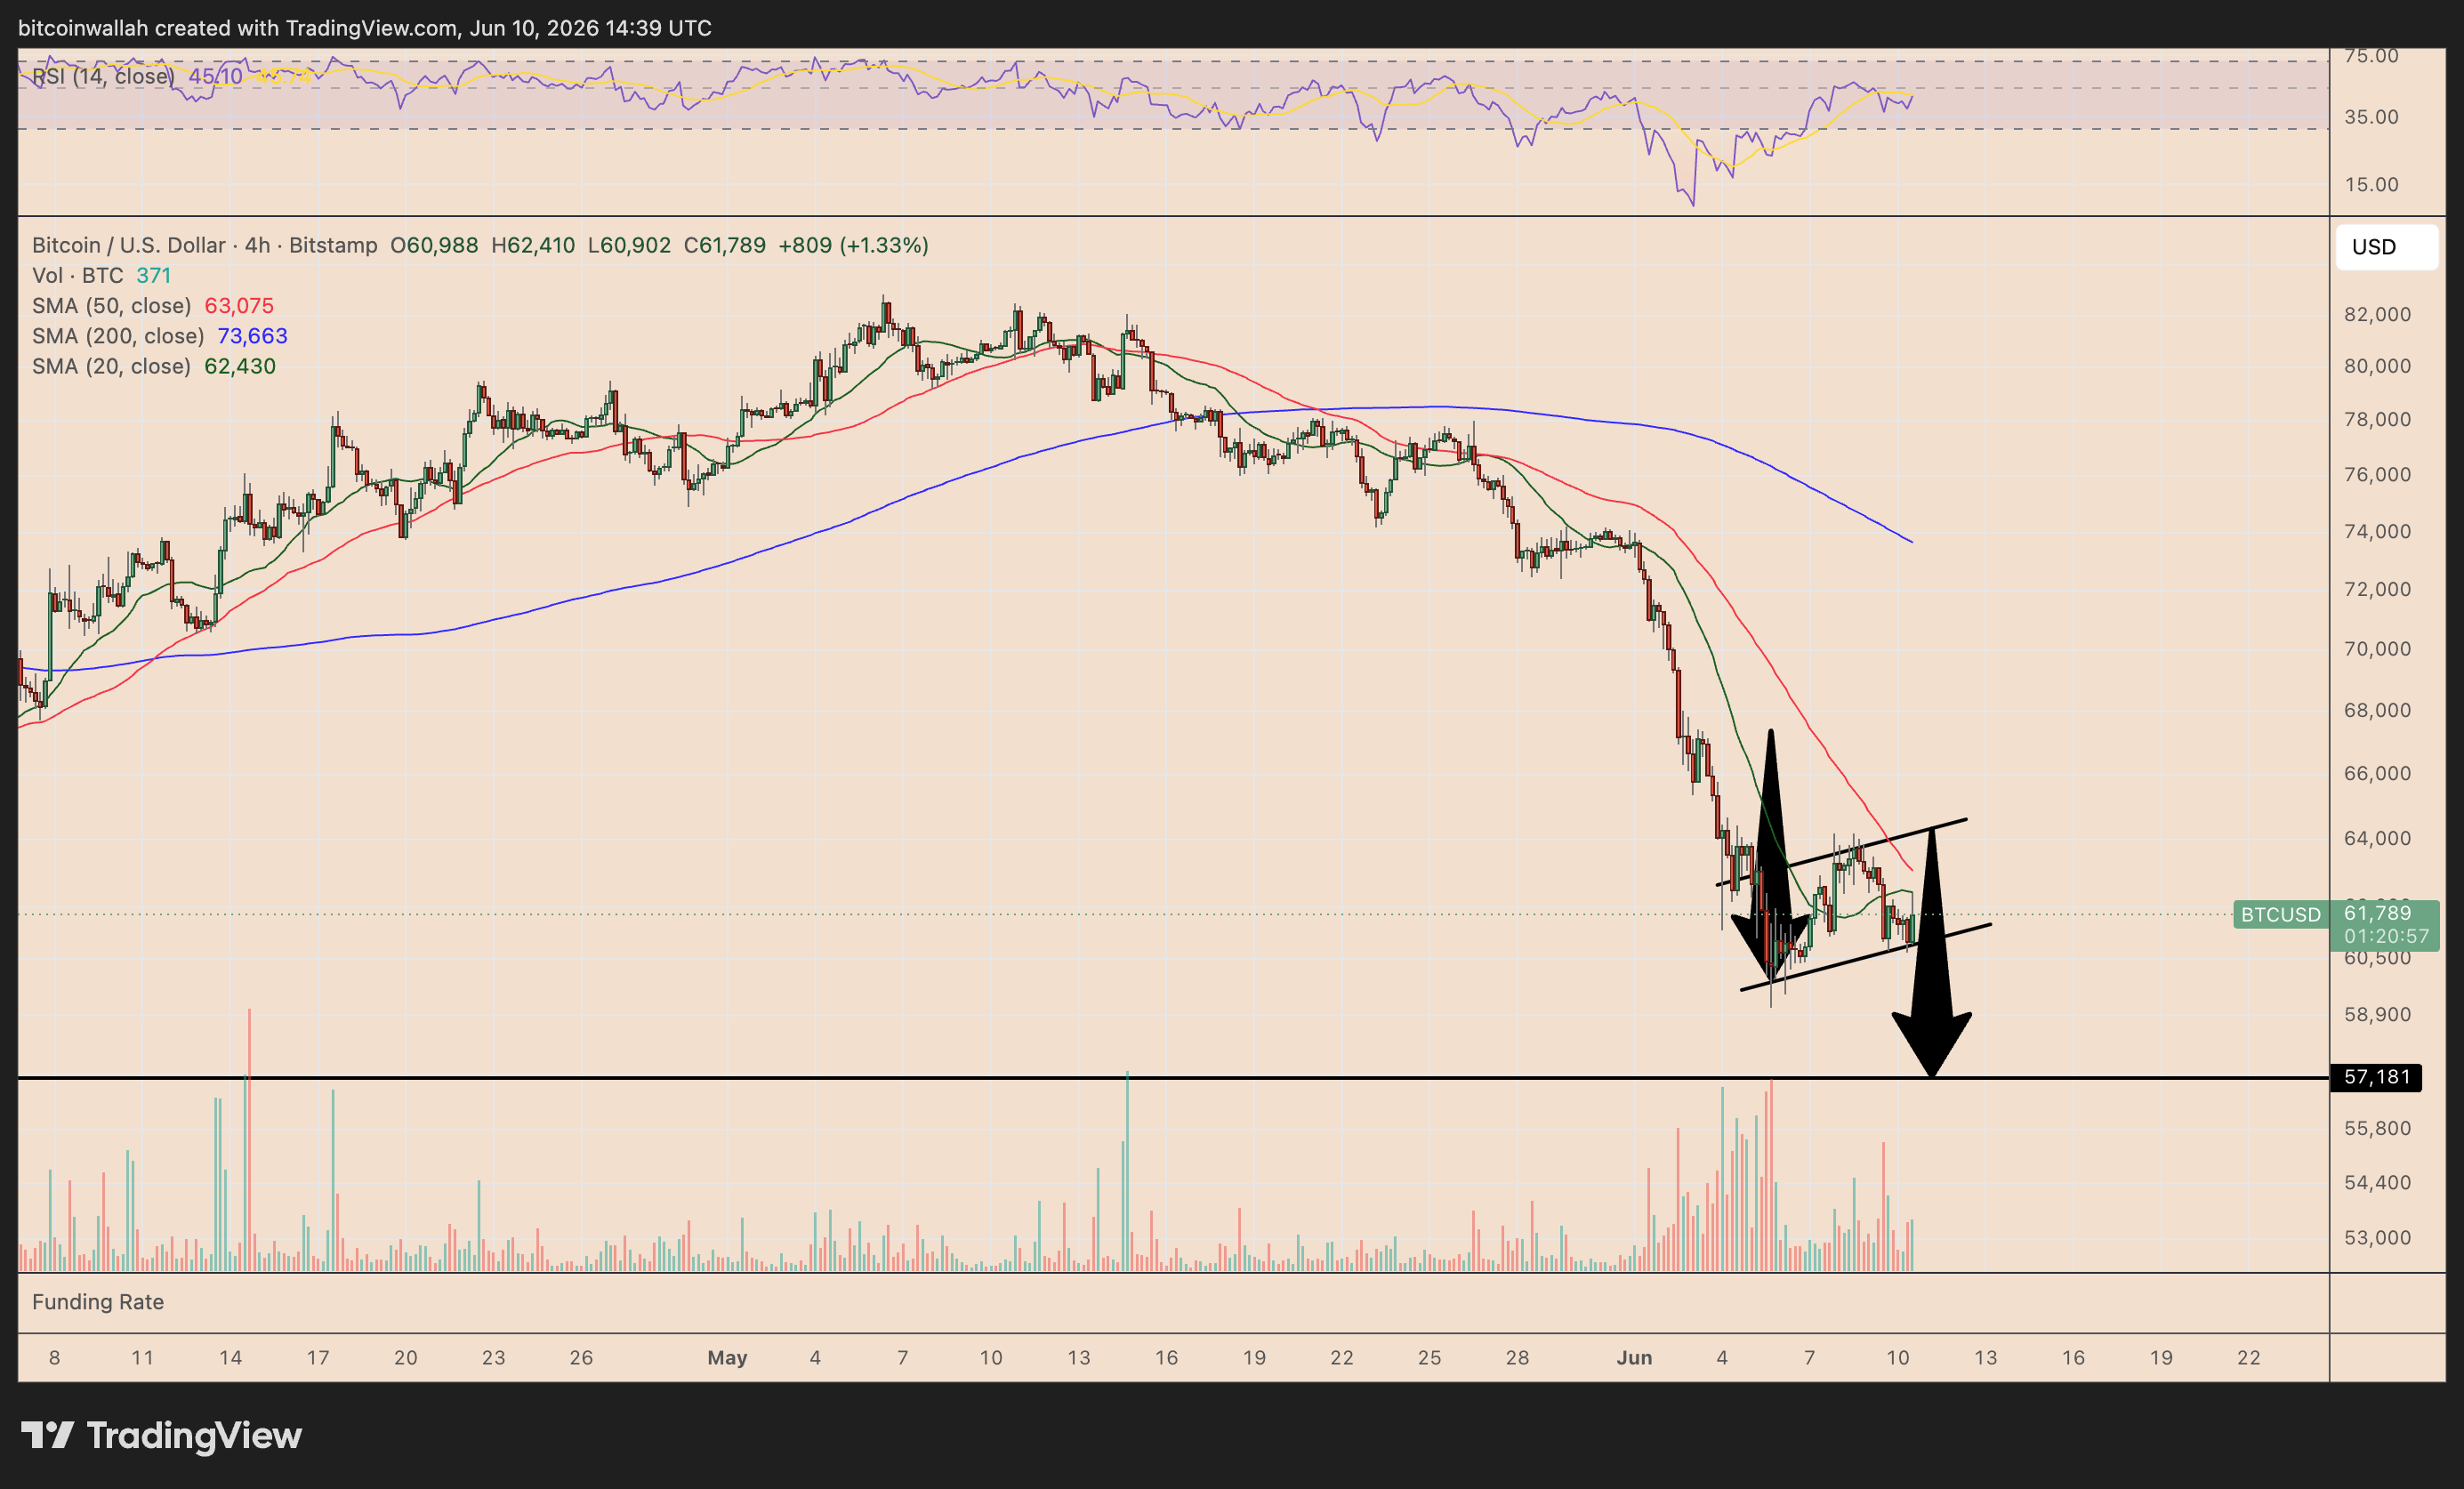
BTC/USD four-hour chart. Source: TradingView
BTC also appears to be consolidating in a bear flag pattern.
This configuration forms when price bounces in a rising parallel channel after a pointed decline. In miniature, a rebound may only be a pause before another decline, not the beginning of a novel upward trend.
According to the principle of technical analysis, a bear flag confirms when the price breaks below the lower trend line of the flag. The measured downside target is equal to the height of the previous sell-off projected from the breakdown point.
This puts Bitcoin’s June bearish target near $57,800, down about 7.6% from the current level.
A Bitcoin relief rebound scenario is also in play
Conversely, a clear break above the resistance confluence of the 20-period SMA, 50-period SMA and the upper flag trendline would weaken the bear flag structure and invalidate the immediate bearish setup.
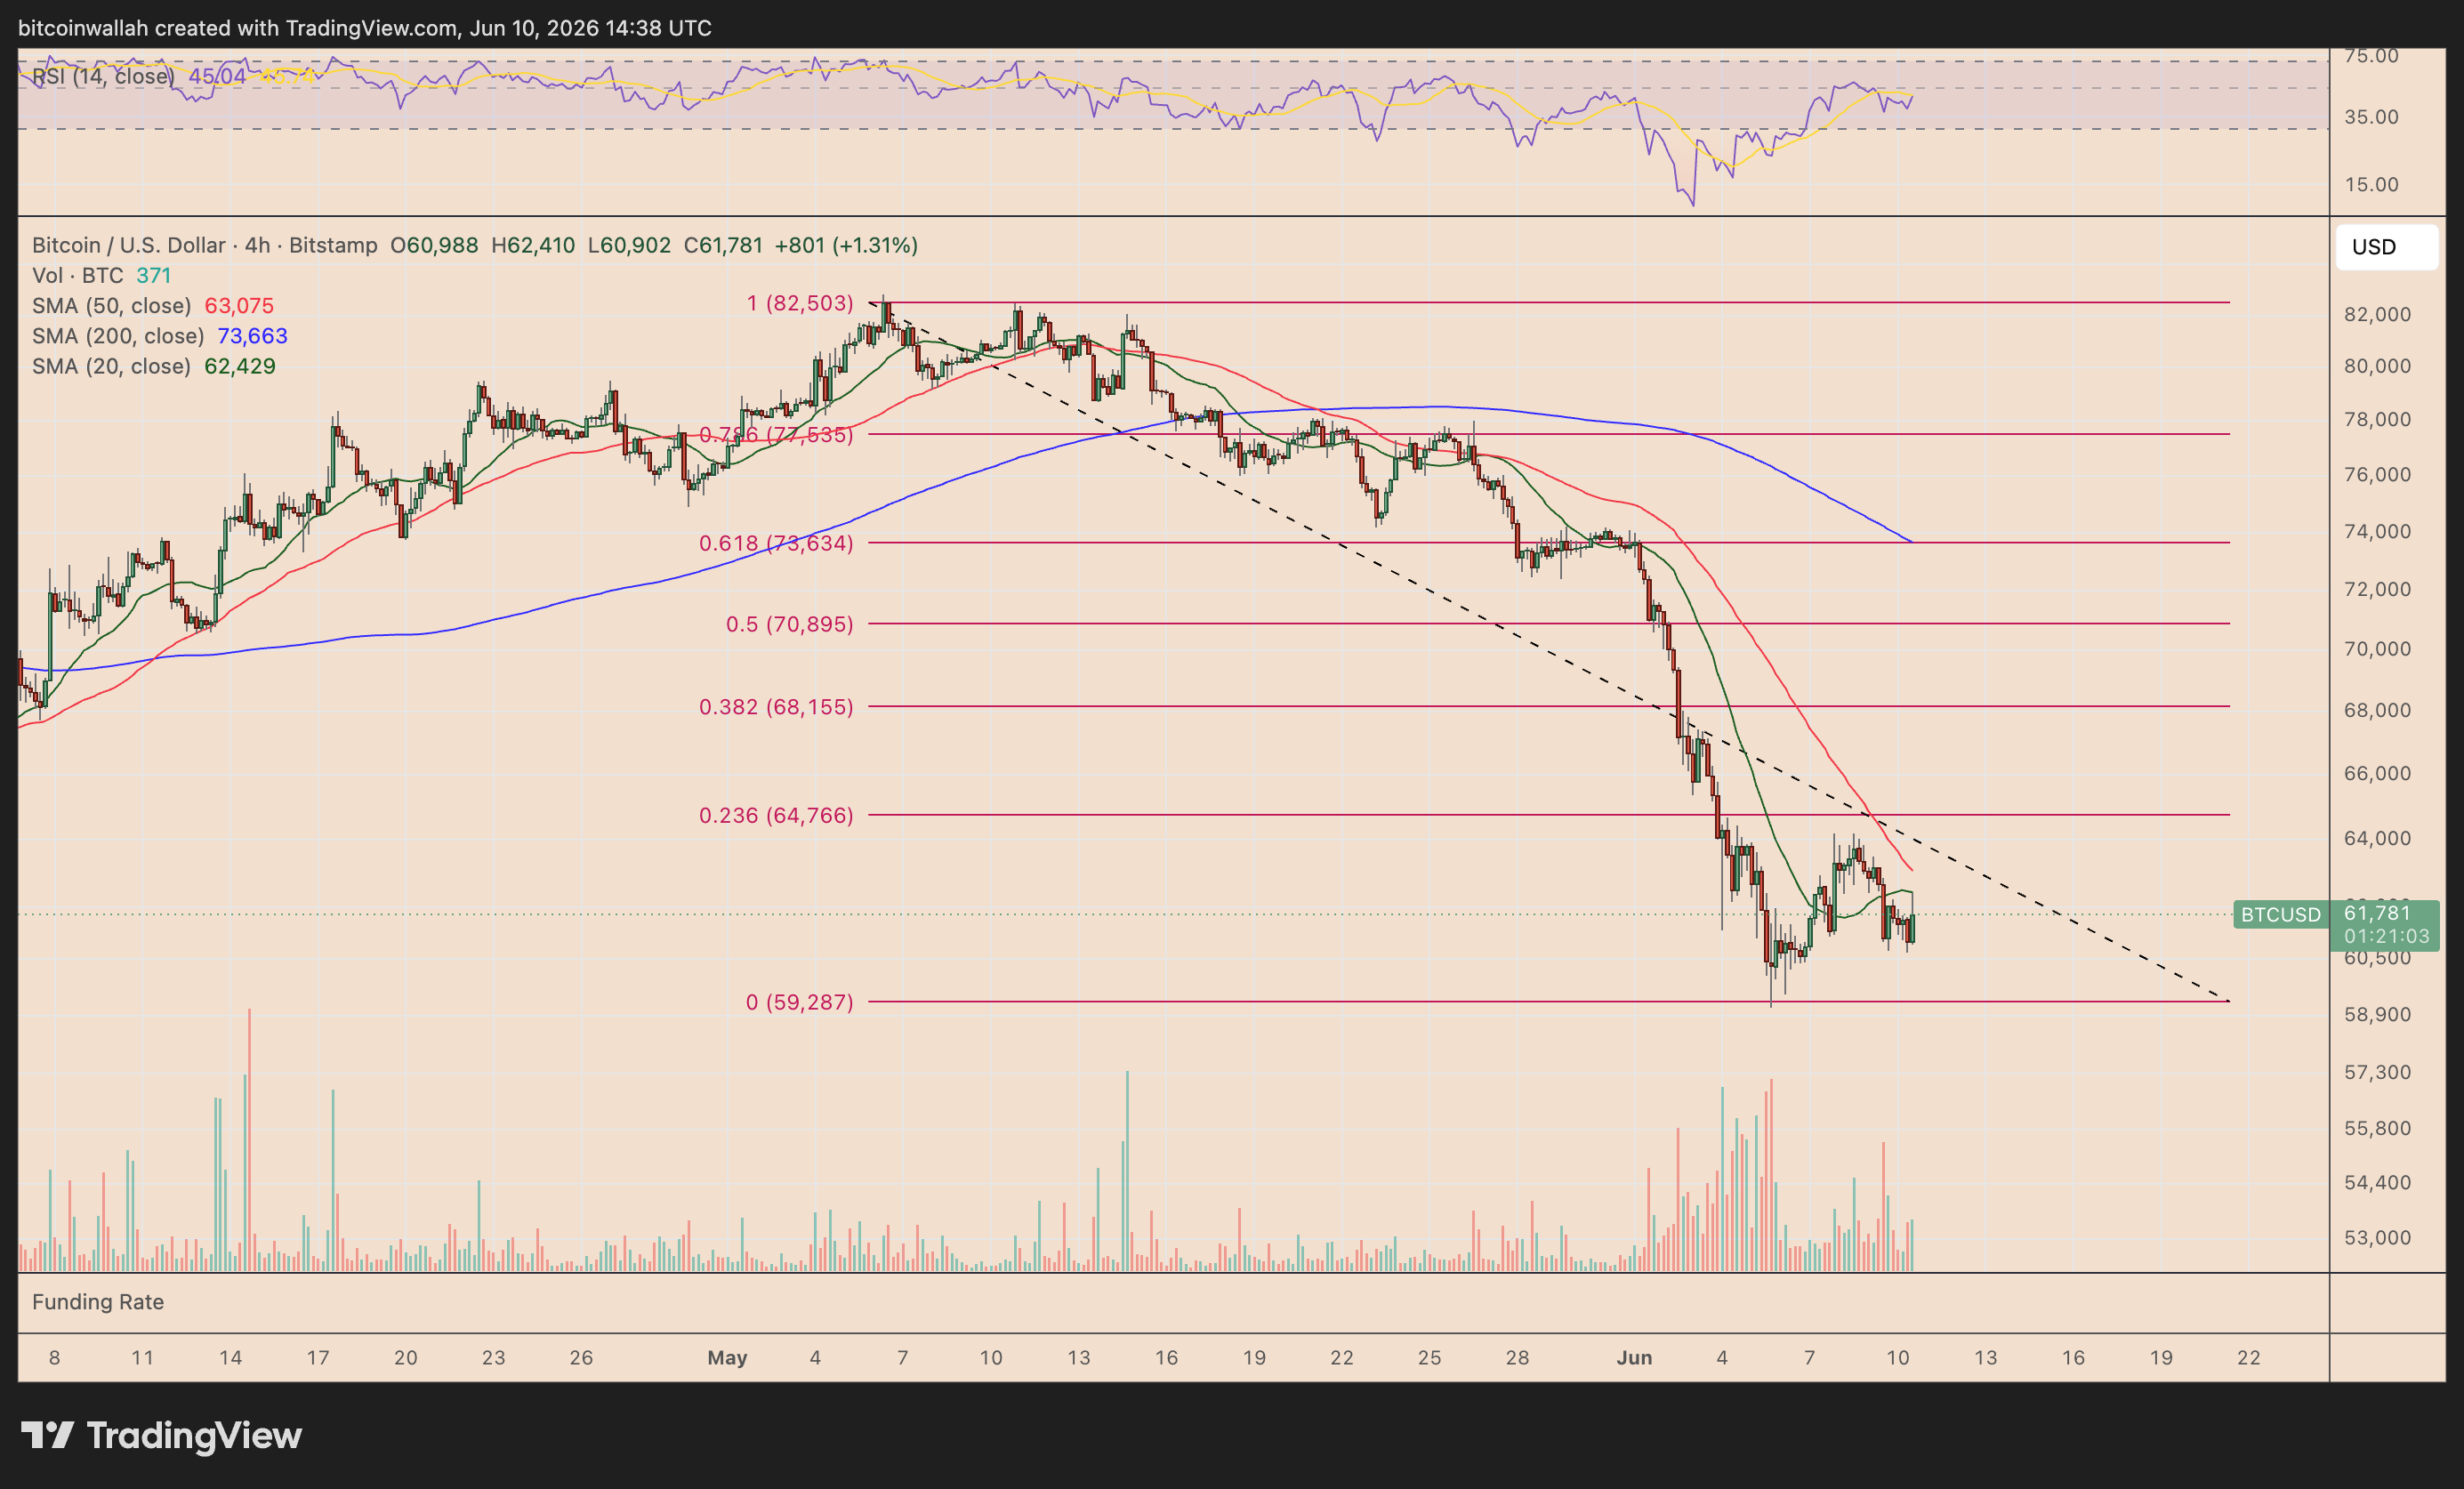
BTC/USD four-hour chart. Source: TradingView
In such a scenario, Bitcoin could extend its June recovery towards the $64,000-$68,000 range by matching the 0.236 and 0.318 Fibonacci retracement lines.