Ethereum, the second largest cryptocurrency by market capitalization, is currently at a critical juncture in its price consolidation phase. This period of price stability, characterized by a narrow trading range, has left traders and investors in a state of uncertainty.
As Ethereum price oscillates around key support and resistance levels, market participants closely monitor technical indicators and market signals to predict the next move. The current consolidation reflects a balance between bullish optimism and bearish caution, creating an environment of indecision that could lead to significant volatility once a breakout direction is established.
This analysis focuses on examining Ethereum’s current price state in order to determine its potential future price action.
Market Overview: Current Ethereum Trends and Analysis
Currently on the 4-hour chart Ethereum price is moving up towards the upper level of the consolidation zone, but is still below the 100-day basic moving average (SMA).
A close examination of the 4-hour Composite Trend Oscillator shows that the ETH price may continue to rise as both the signal line and SMA of the indicator are trending above the zero line. From this formation, it can be suggested that Ethereum could possibly move to test the upper consolidation base before falling again.
On the 1-day chart, ETH is actively moving higher towards the upper base of the consolidation zone while holding above the 100-day SMA. With the way the ETH price moves, it could move into testing the upper consolidation base.
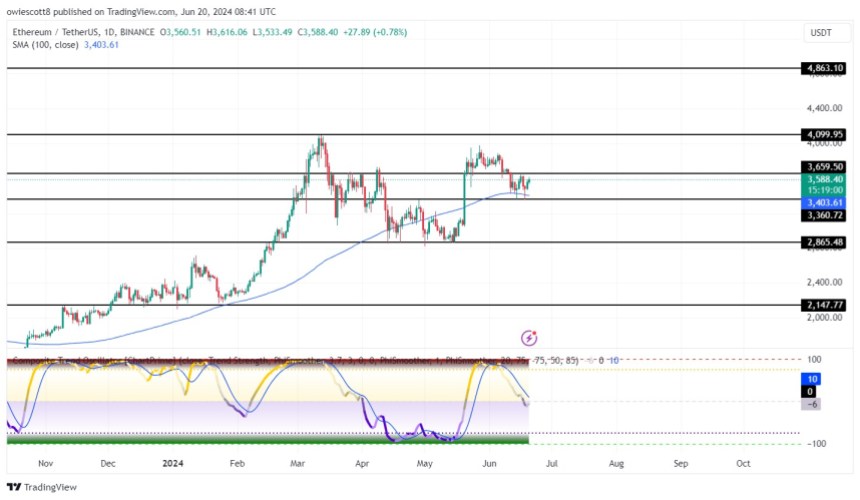
The 1-day Composite Trend Oscillator indicator shows that although ETH is currently in an uptrend, it may decline in the long term as both the signal line and the SMA are trying to cross the zero line.
Potential scenarios: what’s next for ETH?
A look at potential future scenarios for Ethereum’s post-consolidation movement suggests that if the ETH price breaks above the upper consolidation base, it will begin to rise towards $4,099 resistance level. If the price breaks above this level, it could proceed to test its all-time high of $4,863.
In contrast, if the crypto asset falls below the consolidation floor, it will begin to move down towards the $2,865 support level. If this level is broken, it will continue to move lower, testing the $2,147 level and possibly other lower levels.
At the time of writing, ETH was trading around $3,607, down 1.82%, with a market capitalization of over $440 billion and a 24-hour trading volume of over $13 billion. Although the company’s market capitalization decreased by 1.77%, trading volume increased by 28.93% in the last day.
Featured image from Adobe Stock, chart from Tradingview.com