Bitcoin is showing early signs of renewed demand after a February period characterized by robust selling at both retail and institutional venues, even though the broader macro backdrop remains unfavorable for risky assets. On-chain and ETF flow data currently indicate that the market is stabilizing, although not completely compromised yet.
This change is noteworthy because it takes place in a tough context. As a contributor to CryptoQuant, Darkfost put it down“Despite escalating tensions in Iran, Bitcoin continues to show a degree of resilience, particularly compared to stocks and commodities that are increasingly exhibiting superior market structures. This is even more noteworthy given that the upcoming FOMC meeting is unlikely to bring any rate cuts.”
In other words, the market is improving despite the macro rather than because of it. Darkfost noted that current probabilities point to about a 99% chance of no change from the Federal Reserve, which has investors focusing less on immediate policy moves and more on future guidance, especially whether officials will reopen the door to future rate hikes.
In this configuration, the exchange flow data started to look better. According to Darkfost, the 30-day moving average delta volume on Binance and Coinbase has shifted back towards buyers after a deep negative decline in mid-February. On February 16, the indicator was -$145 million on Binance and -$88 million on Coinbase, meaning that “both retail and institutional participants were largely in agreement on the sell side.” Currently, these averages have returned to positive territory at around +$21 million and +$14 million.
This is still a modest move. But compared to conditions a month ago, this marks a marked change in tone.
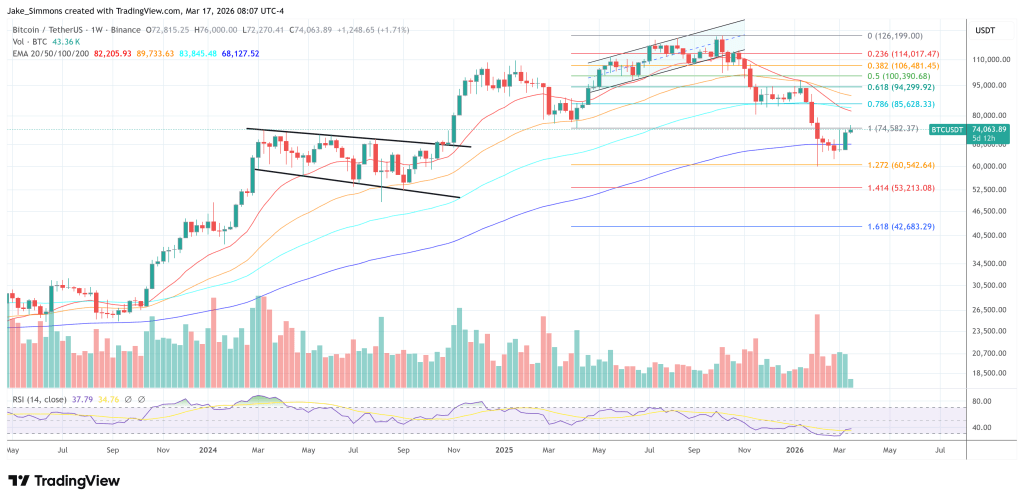
Why $79,962 remains key resistance for Bitcoin
ETF Flow Data presented by CryptoQuant contributor Axel Adler Jr. tells a similar story, though with an essential caveat. U.S. bitcoin spot ETF flows have gone from capitulation to recovery over the past month. From February 15 to February 24, the average 7-day net flow remained negative, reaching a low of -1,883 BTC per day on February 18.
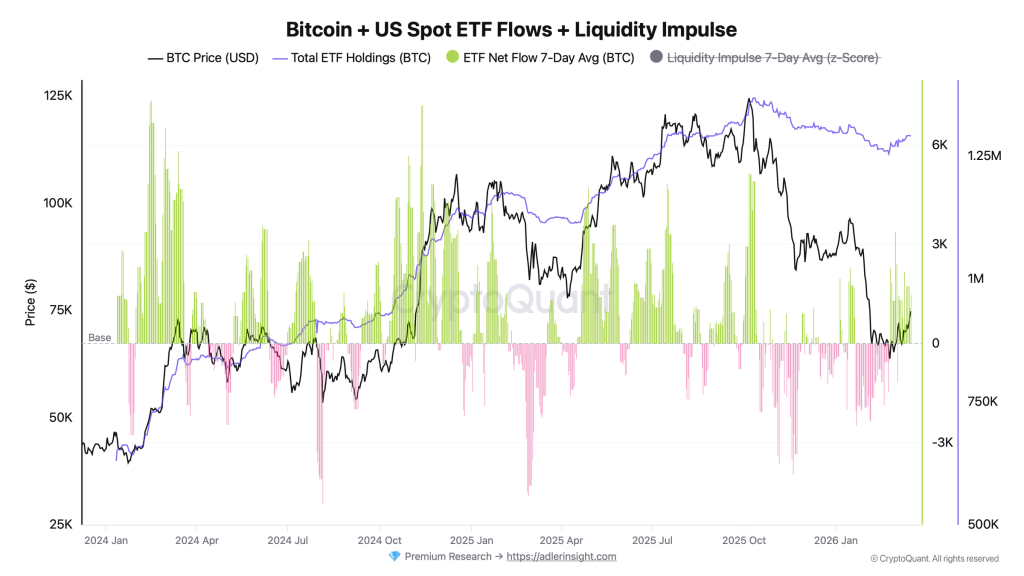
The trend reversal began on February 25, when flows increased to +2,305 BTC per day before peaking at +3,387 BTC per day on March 2. The latest reading dropped to +1,472 BTC per day, while the ETF’s total holdings increased from 1,264,982 BTC to 1,291,618 BTC in the month, an boost of 26,636 BTC.
Adler’s conclusion is constructive but balanced. “ETF flows have returned after the February outflow, liquidity is back to positive levels – demand is back,” he wrote. “But until the spot closes above the realized price (~$80K), the ETF cohort remains underwater, and this level will likely slow any upside.”
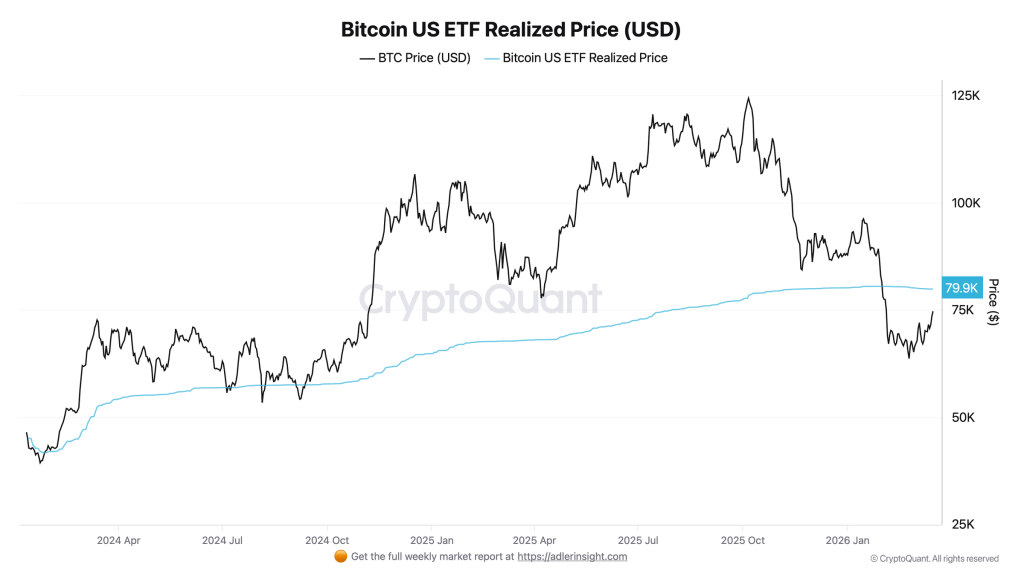
This realized price is currently $79,962, down slightly from $80,501 on February 15. Even after bitcoin rebounded from $63,756 on February 24 to $74,788, spot trading is still trading $5,174, or 6.5%, below the total cost of the ETF cohort. This leaves a vast group of holders with unrealized losses and creates the risk that any move towards $80,000 will draw supply away from investors looking to exit near breakeven.
For now, both analysts describe the same market: selling pressure has subsided, buyer activity has returned and institutional demand is no longer deteriorating. But confirmation still matters.
At the time of publication, Bitcoin was trading at $74,063.
Featured image created with DALL.E, chart from TradingView.com