Altcoin coverage on Binance has deteriorated rapidly, with the enormous majority of tokens now trading below the widely observed long-term trend level, a signal of exhaustion that Darkfost, co-founder of CryptoQuant, labels as a liquidity problem as much as a pricing problem.
In a post on X, Darkfost (@Darkfost_Coc) shared a CryptoQuant chart tracking the share of Binance-listed altcoins trading below their 50-week moving average along with the price of Bitcoin. His headline claim: “LIQUIDITY CURVE SENDS 83% OF ALTCOINS INTO BLUE TREND,” arguing that most investors exposed to non-Bitcoin assets and volatile coins “are currently in significant difficulty,” especially those who still hold positions.
Altcoin breadth spreads across Binance
Darkfost’s chart, titled “Altcoin Performance (Binance),” shows the percentage of altcoins below the 50-week moving average returning to historically tight territory. His latest reading shows that 83% of Binance altcoins are below this threshold, which means that the weakness is not confined to a few names but is spreading across the tape.
He also pointed to an even more extreme episode from earlier this month. “Since the end of the 2023 bear market, a new record was set on February 7, with over 92% of altcoins on Binance trading below this key technical support,” he wrote, describing it as the highest level of bearish participation after the 2023 cycle.
This is in stark contrast to conditions observed in earlier phases of growth. Darkfost noted that in March 2024, only 6% of Binance altcoins were trading below the 50-week line, and in December 2024, that number was 7%. He added that outside of these multi-month windows, at least half of the altcoins remained below the threshold, a behavior he described as significantly different from the width dynamics of the previous cycle.
Darkfost characterized the altcoin decline as inextricably linked to Bitcoin’s trend and macro backdrop, suggesting that the market’s risk budget has narrowed while altcoin supply has increased.
“The market continues to be driven by BTC movements, which have been in a downtrend since October 2025 after an ATH of $126,000. Currently, BTC dynamics remain highly uncertain, with the price still hovering around 46% of its all-time high. Rising geopolitical tensions, particularly between the US and Iran, combined with increasingly hawkish forecasts and the Fed’s tone expressed in recent minutes FOMC, make the current environment particularly challenging for highly volatile assets such as altcoins,” he wrote.
The chart itself marks BTC near the mid-$60,000 range, highlighting its broader point: in a regime where Bitcoin’s direction is unclear and macro data is hostile to duration and volatility, higher-beta token breadth can quickly deteriorate and then remain weakened.
Why the 50-week line matters
Darkfost highlighted the 50-week moving average as a long-term filter used by market participants to separate corrective from structurally constructive phases. When most tokens are trading below, rallies tend to become narrower, selection pressure increases, and “alternate season” narratives become more complex to sustain without a decisive change in liquidity conditions.
He attributed the current setup to “an increase in altcoin supply in the broader cryptocurrency market coupled with still tight liquidity conditions,” which could mechanically dampen marginal flows. In such an environment, he argued, outperformance depends less on broad exposure to beta and more on understanding how market structure has changed.
At press time, the total market capitalization of cryptocurrencies excluding Bitcoin was $943.46 billion.
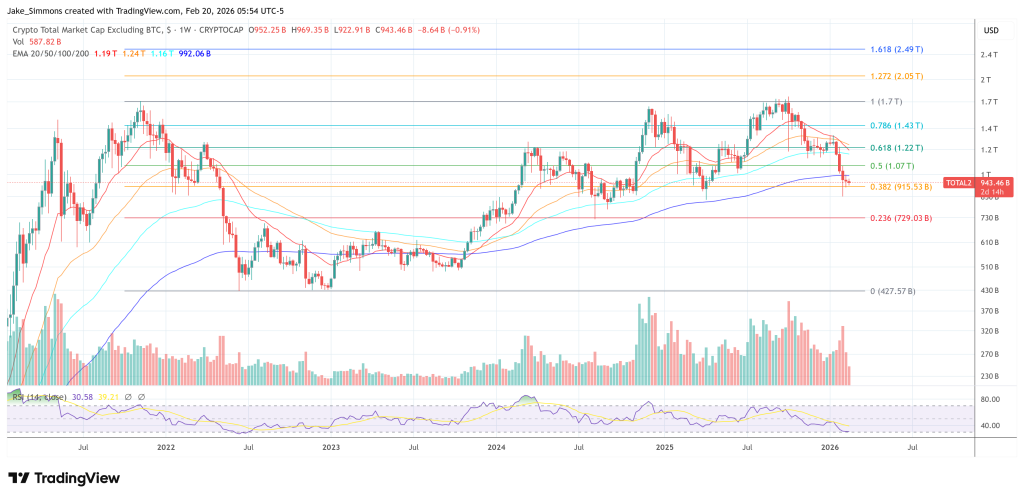
Featured image created with DALL.E, chart from TradingView.com