If prominent analysts are to be believed, Bitcoin (BTC) seems poised for a major breakout. The world’s most popular cryptocurrency has been stuck in a consolidation phase for a record 87 days, but experts say the sleeping giant could soon wake up and take revenge.
Sets a course for a breakthrough
Faibik, a renowned cryptocurrency analyst, has identified a technical pattern on Bitcoin’s daily chart that indicates a potential explosion. This pattern, known as a descending widening wedge, suggests a price squeeze that often precedes a significant breakout. Faibik believes that a rise above the key resistance level at $71,000 would be a robust bullish signal, pointing to a potential reversal of the recent downtrend.
$BTC The descending widening wedge pattern is still in play on the daily time chart..📈
Once Bitcoin bulls reach the key resistance at 71.3k, the party will begin. 🔥🚀
Trust the process…✍️#Crypto #Bitcoin #BTC pic.twitter.com/gBas14jIDo
— Captain Faibik (@CryptoFaibik) June 9, 2024
DBW on the BTC chart is a sign that the price is becoming more stringent, Faibik explained in a recent post. This usually leads to a breakout in one direction or another, and based on current market sentiment, a bullish breakout seems more likely.
A quick overview of Bitcoin prices
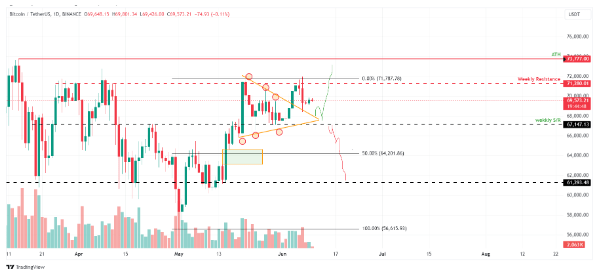
Using trend lines to connect three lower highs and three higher lows, Bitcoin price broke out of a symmetrical triangle on June 4. Nevertheless, the weekly resistance at $71,280 did not allow for a break.
At the $68,500 level, which is the upper edge of a symmetrical triangle, BTC is currently finding support. Bitcoin may augment by 7% will reach an all-time high of $73,777 if current support is maintained.
Will Bitcoin become a bullish butterfly?
Mags, another popular cryptocurrency analyst, takes a slightly different approach. He sees the current phase of consolidation as the longest Bitcoin has ever experienced, surpassing previous periods before significant price increases.
The analyst compares this prolonged consolidation to a butterfly in its chrysalis, suggesting a potential transformation on the horizon.
Historically, Bitcoin has tended to consolidate around historical highs, followed by a price discovery phase that precedes keen price movements, the analyst said. The current 87-day consolidation period is breaking previous records, potentially indicating that a massive price move is imminent.
Mags highlights previous instances where similar periods of consolidation preceded major bull rallies. For example, in 2017, Bitcoin consolidated for 48 days before breaking out, while in 2020 the consolidation phase lasted 21 days before a significant price augment.
Resistance level 71.3 thousand dollars
Both Faibik and Mags agree that a breakout from the current consolidation phase could be a game changer for Bitcoin. They advise investors to keep a close eye on the resistance level at $71,300, as a rise above that point could signal the beginning of a bullish trend.
Featured image from shopping sites, chart from TradingView