XRP price action is trading just above $2, but technical analysis of the medium-term charts shows a more elaborate corrective structure for what comes next.
According to technical analysis provided by CasiTrades on X, XRP may still have one more bullish push ahead before the structure collapses. The analysis chart shows an developing Elliott Wave sequence that could first drive the XRP price higher and then open the door to a crash if support levels fail.
The B wave is fading, indicating an upcoming C wave
Technical analysis The XRP price action on the 1-hour candlestick chart by CasiTrade offers an intriguing perspective that shows that XRP may end up correcting below $2 in the coming days. However, this correction will only be applied after XRP completes the Wave C movement this pushes its price above $2.2.
In turn, wave C. he is expected to play after recently falling to $2.03 in the last 48 hours. According to CasiTrades, the recent XRP pullback has developed into a deeper B wave than initially expected. Instead of forming a tight consolidation, the price made a full ABC move and fell to the Fibonacci retracement level at 0.618 near $2.09. However, this depth does not invalidate the structure. Such a move is consistent with wave B in the Elliott wave theory.
This retracement coincides with clustered Fibonacci levels and earlier intraday support, and the next possible move from here will be another leg higher within the larger Wave 2 structure.
Now that wave B is likely, attention turns to the expected wave C push. CasiTrades identifies the gold retracement near $2.26 as the main upside target, with a possible extension to the $2.28 area where the gold pocket and extension at 1.236 converge. The chart shows this zone as a dense area of resistance, reinforced by previous reaction highs and overlapping Fibonacci projections.
This C wave is expected to split into five smaller waves. If things proceed as expected, XRP price action should appear bullish thanks to pure subwave development. However, how the price behaves as it approaches and responds to the $2.26-$2.28 range will be key to confirming the broader outlook and a possible subsequent correction.
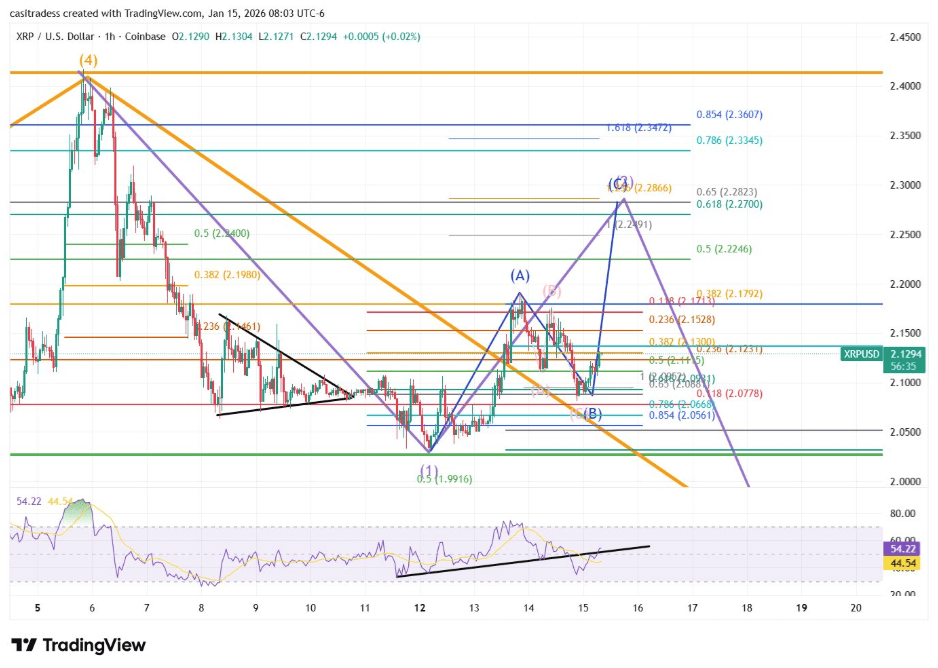
XRP price chart. Source: @CasiTrades on X
A rejection after C could drag XRP to $1.65
The Our focus now is on opportunity push higher, but there is still a risk of loss after wave C ends. The analyst expects a rejection that could be the beginning of a larger downward move in Wave 3 when XRP reaches the predicted level around USD 2.26-2.28.
If this rejection materializes clearly, XRP could begin a sustained move lower, with the macro support area around $1.65 becoming a concern again. Confirmation of this bearish path, however, depends on how the C subwaves form and whether the price provides a decisive rejection.
Featured image from Unsplash, chart from TradingView