Dogecoin (DOGE) is entering technically essential decision territory after a pointed rebound, but multiple chart readings from many respected cryptocurrency analysts are converging on the same point: the rally only moves from “relief” to “reversal” if DOGE manages to clear the $0.15 averages and establish a novel local high.
Dogecoin is rising, but the real test is $0.157
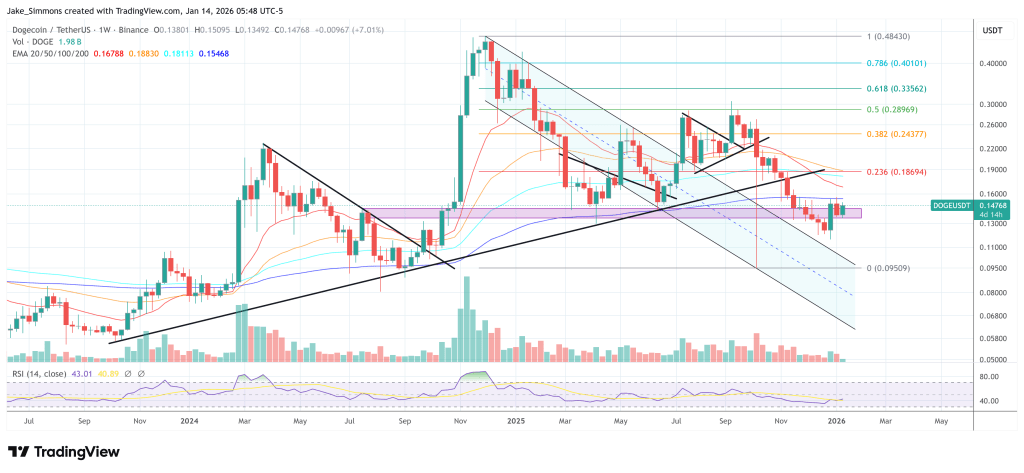
Kevin’s formulation (Kev_Capital_TA) clearly defines what confirmation looks like. “Dogecoin, like BTC and many other Altcoins, has come back and successfully tested its key 4HR MAs after breaking out of them in an attempt to complete its major corrective phase. A successful retest followed by a new local high will be further evidence that the corrective phase has ended exactly in the zone where we predicted. A new high would mean a break of 0.157 cents.”
From Kevin’s 4-hour perspective, DOGE continued to trend down for months while repeatedly failing to meet the downward moving average bands. Several previous rejections are marked on the chart. The recent rally is noticeable because the price regained these averages and then returned to them, holding the retest rather than moving straight up. This behavior is consistent with the regime trying to move from “sell on the dip” to “buy on the dip”, but the chart clearly shows that the market is still trading within a broader downtrend structure unless it manages to force a higher top.
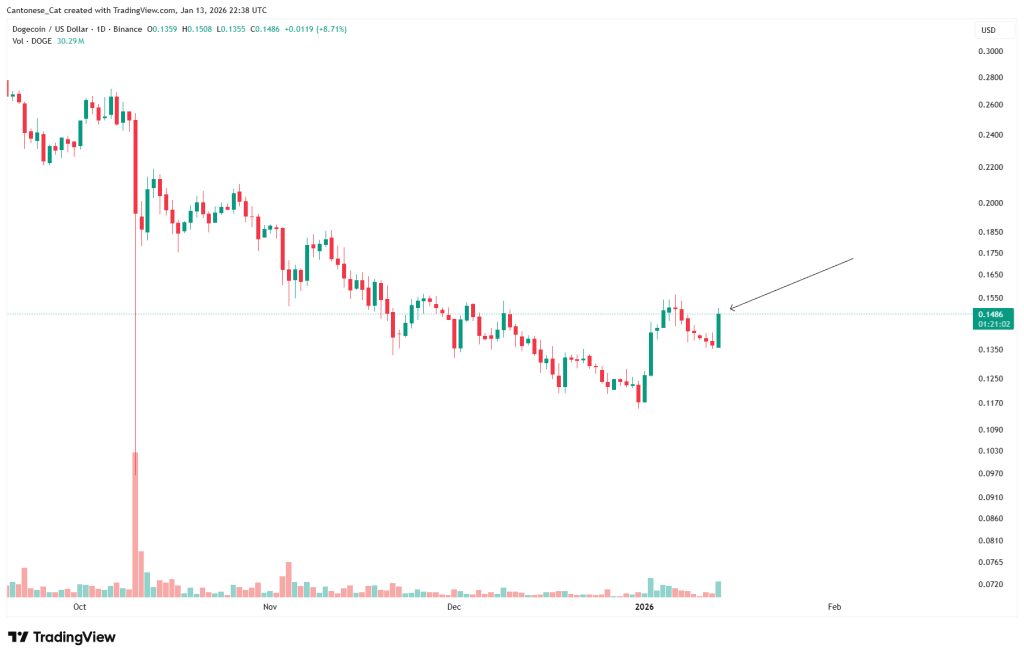
Cantonese Cat’s daily snapshot captures in real time where this friction occurs. The final candle closes at $0.1486 after printing $0.1508 that day, effectively heading into the same area where sellers were leaning earlier.
He writes: “DOGE introduces another bullish daily candle that consumes the last 5 bearish candles.” Although this is a bullish signal and a short-term impulsive move, Dogecoin bulls still need to reach a novel, higher high.
@BigCheds Daily Dashboard Highlights the Importance of the $0.15 Average: DOGE remains influenced by sharper trend measures, with the 34-day EMA at $0.1828 and the 200-day SMA at $0.2212 still well above.
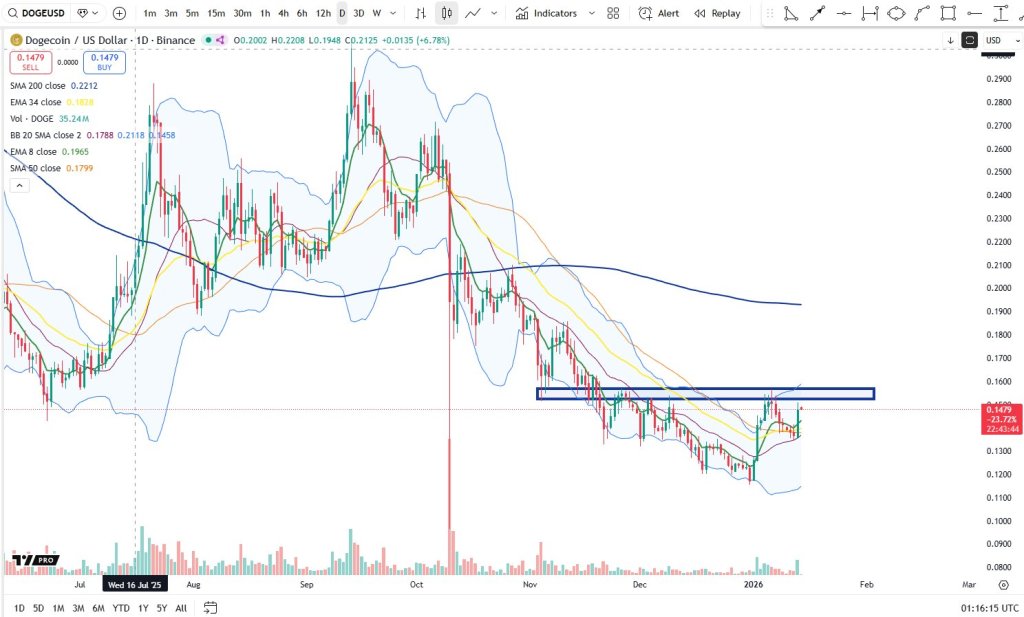
The Bollinger Bands show that DOGE is bouncing off the lower band compression, with the lower band near $0.11, the base near $0.135, and the upper band near $0.16. The price first bounced off the lower band, broke through the base and reached the upper band, then returned to the base, held the retest and now rotates back towards the upper envelope.
The setup is clear: holding above the recovered short-term averages and breaking $0.157 will complete the “retest then higher high” sequence that Kevin is observing, while forcing a price break through the daily supply zone that Big Cheds has closed. A re-impact of the upper Bollinger Band would confirm that momentum is increasing in the direction of the move.
Failure to clear this zone and then moving back under the reclaimed MA area will shift attention first to $0.1319, then $0.1208, with $0.1068 being the deeper line shown on the chart.
At press time, DOGE was trading at $0.14768.
Featured image created with DALL.E, chart from TradingView.com