ASX: ANZ GROUP HOLDINGS LIMITED – ANZ Elliott Elliott Wave Technical Analysis TradingLounge.
Hello, Our Elliott Wave analysis today includes an Australian Stock Exchange (ASX) update on ANZ GROUP HOLDINGS LIMITED – ANZ. We see ASX:ANZ potentially falling in the coming period.
ASX: ANZ Group Holdings Limited – ANZ 1D Chart Analysis (Semi Logical Scale).
Function: Main trend (medium, orange).
Mode: Theme.
Structure: Impulse.
Position: Wave ((a)) – navy blue Wave 4 – orange.
Details: Wave (3)-orange has probably ended and wave (4)-orange is going much lower, targeting around 27.25. So the previous long trade is likely at risk. We can consider exiting the position earlier with a shorter stop than the original one.
Point of invalidation: End of wave (3) – orange.
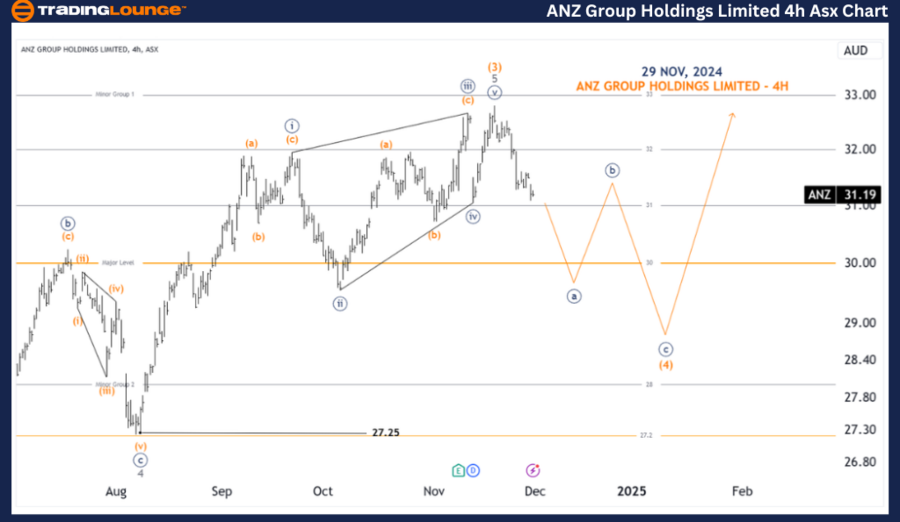
ASX: ANZ Group Holdings Limited – ANZ Four Hour Chart Analysis
Function: Main trend (medium, orange).
Mode: Theme.
Structure: Impulse.
Position: Wave ((a)) – navy blue Wave (4) – orange.
Details: It is quite clear that the 5-gray wave took a long time to develop and lacked strength, which suggests that it is a slash ending, so it is very likely that ASX:ANZ will decline sharply in the coming period. The rate will probably head towards the minimum of 27.25.
Point of invalidation: End of wave (3) – orange.
Application:
Our analysis, contextual trend forecast and short-term outlook for ASX: ANZ GROUP HOLDINGS LIMITED – ANZ are designed to provide readers with insight into current market trends and how to effectively capitalize on them. We offer specific price thresholds that act as signals to validate or invalidate our wave count, increasing confidence in our perspective. By combining these factors, we strive to offer readers the most objective and professional view of market trends.
Technical Analyst: Hua (Shane) Cuong, CEWA-M (Master Appointment).

