Bitcoin’s latest price action may show the first signs relief as a closely watched U.S. demand-linked indicator just changed direction. The Coinbase Premium gap returned to positive territory after nearly 10 weeks of sustained negative readings, which coincided with Bitcoin’s price falling from around $95,000 to below $65,000 in February.
Coinbase Premium turns positive
The Coinbase Premium Gap, which measures the price difference between Bitcoin on Coinbase, the main exchange for U.S. institutional and retail investors, and its price on offshore platforms such as Binance, remained negative throughout Bitcoin’s correction from $95,000 to the mid-$60,000 range.
Whenever the Coinbase premium gap is negative, it usually means that US traders are selling Bitcoin at a faster rate than buyers are moving in. A positive gap indicates opposite demand dynamics from US investors, which causes Coinbase prices to be higher compared to prices in the global market.
It is worth noting that on January 1, the indicator entered a persistent negative zone and remained there until March 7, a period during which US spot market demand was largely absent among cryptocurrency investors.
At its worst, the gap reached -175 on February 2, coinciding with the most severe phase of Bitcoin’s price collapse. At the time of writing, the Coinbase premium gap has turned positive, registering a reading of +25.4 according to data provided by CryptoQuant analyst @IT_TECH_PL. Reversing the Coinbase premium gap from a low of -175 to a positive reading is the first step towards significant change in market structure.
Image of a chart with X. Source: @IT_TECH_PL
The current reading, while still early and modest compared to the depth of the previous negative regime, is the first consistent signal that it is American spot demand may return to Bitcoin. It shows that the same participants can slowly accumulate Bitcoin again compared to the rest of the world. However, the broader structure of Bitcoin’s price action still leaves room for further declines before an eventual bottom forms.
Bitcoin could still fall to $50,000 before hitting bottom
At least a few signals in the chain slowly become constructive, several analysts are cautious before declaring the end of a broader correction. Technical analysis by cryptocurrency analyst Ted Pillows points to a long-term technical indicator that has always aligned with Bitcoin’s lows.
According to his observations, the last two major bear market lows occurred below the 300-week exponential moving average (300W EMA). In both cases, Bitcoin fell more than 15% below the benchmark before a final bottom was established.
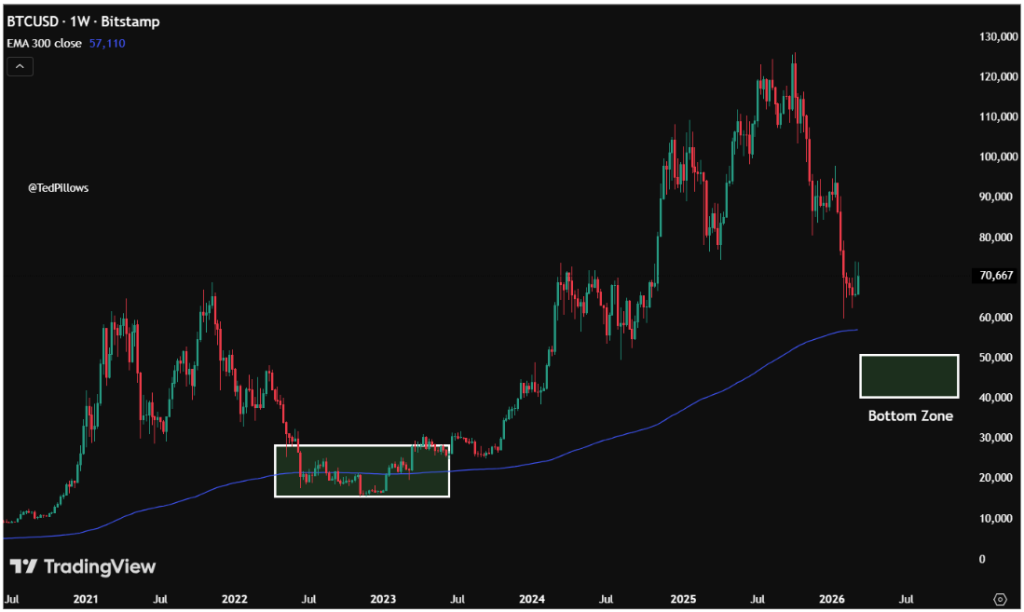
Bitcoin price chart. Source: @TedPillows On X
Bitcoin’s 300-week EMA is currently around $57,100. Using the same formula would mean: a possible move up to approximately $50,000, which would be about 15% below the rate. Nevertheless, this prediction does not guarantee that Bitcoin will reach this level again before forming the bottom.
Featured image from Pexels, chart from TradingView