The latest on-chain data shows that Bitcoin’s price is currently in an crucial phase, raising suspicions whether the market is approaching a cyclical bottom.
The Mayer multiple drops to 0.6 – what does that mean?
In a recent Quicktake post on the CryptoQuant platform, network analyst Ruga Research he noticed that Bitcoin price currently has a 40% negative deviation from its 200-day moving average. This on-chain observation is for Bitcoin Mayer multiples.
For context, the Mayer Multiple indicator tracks how much a coin’s current price is above or below its long-term trend. This indicator is able to achieve this by dividing the price by the 200-day moving average.
When the metric shows a reading of 1, it usually means that Bitcoin’s price is trading around the 200-day MA. Meanwhile, readings above 1 indicate that Bitcoin’s price is higher compared to its long-term trend, while readings below 1 suggest that the price is trading at a discount.
Historically, the metric has had several thresholds in conjunction with market conditions. For example, when the indicator reaches above 2.4, it often signals that Bitcoin’s price is in the overbought zone (also known as bubble territory).
As explained earlier, 1 – 1.5 represents the normal bull market range, while 0.8 – 1.0 is typically the discount zone (where accumulation often occurs). Specifically, when the price drops to regions below 0.8, it signals that Bitcoin’s price has been oversold due to capitulation events.
Ruga Research revealed that the indicator currently stands at 0.6, which reflects approximately a 40% deviation from Bitcoin’s long-term trend. Hence, it is obvious that Bitcoin’s price is at a statistical extreme.
Historical data where the Mayer multiple has fallen to similar levels also lends credence to the validity of this level. In December 2018, the indicator dropped to the 0.5 – 0.6 range (near Bitcoin’s market bottom around $3,200) before the price surged over 540%.
Similarly, the indicator dropped to 0.5 due to the Covid-19 crash, after which it rebounded and Bitcoin price increased by 1100% in the subsequent 12-month period. This scenario also repeated itself in November 2022 when Mayer Multiple fell to the same region, after which the BTC price increased by over 170%.
However, Ruga Research mentioned with the caveat that this indicator does not accurately predict where and when a bottom will form, but only shows what can be expected in the long term. It is also possible that this indicator will see further downward movement or some consolidation before it moves higher.
Bitcoin price at a glance
At the time of writing, Bitcoin is worth approximately $70,383, reflecting an escalate of over 2% in the last 24 hours.
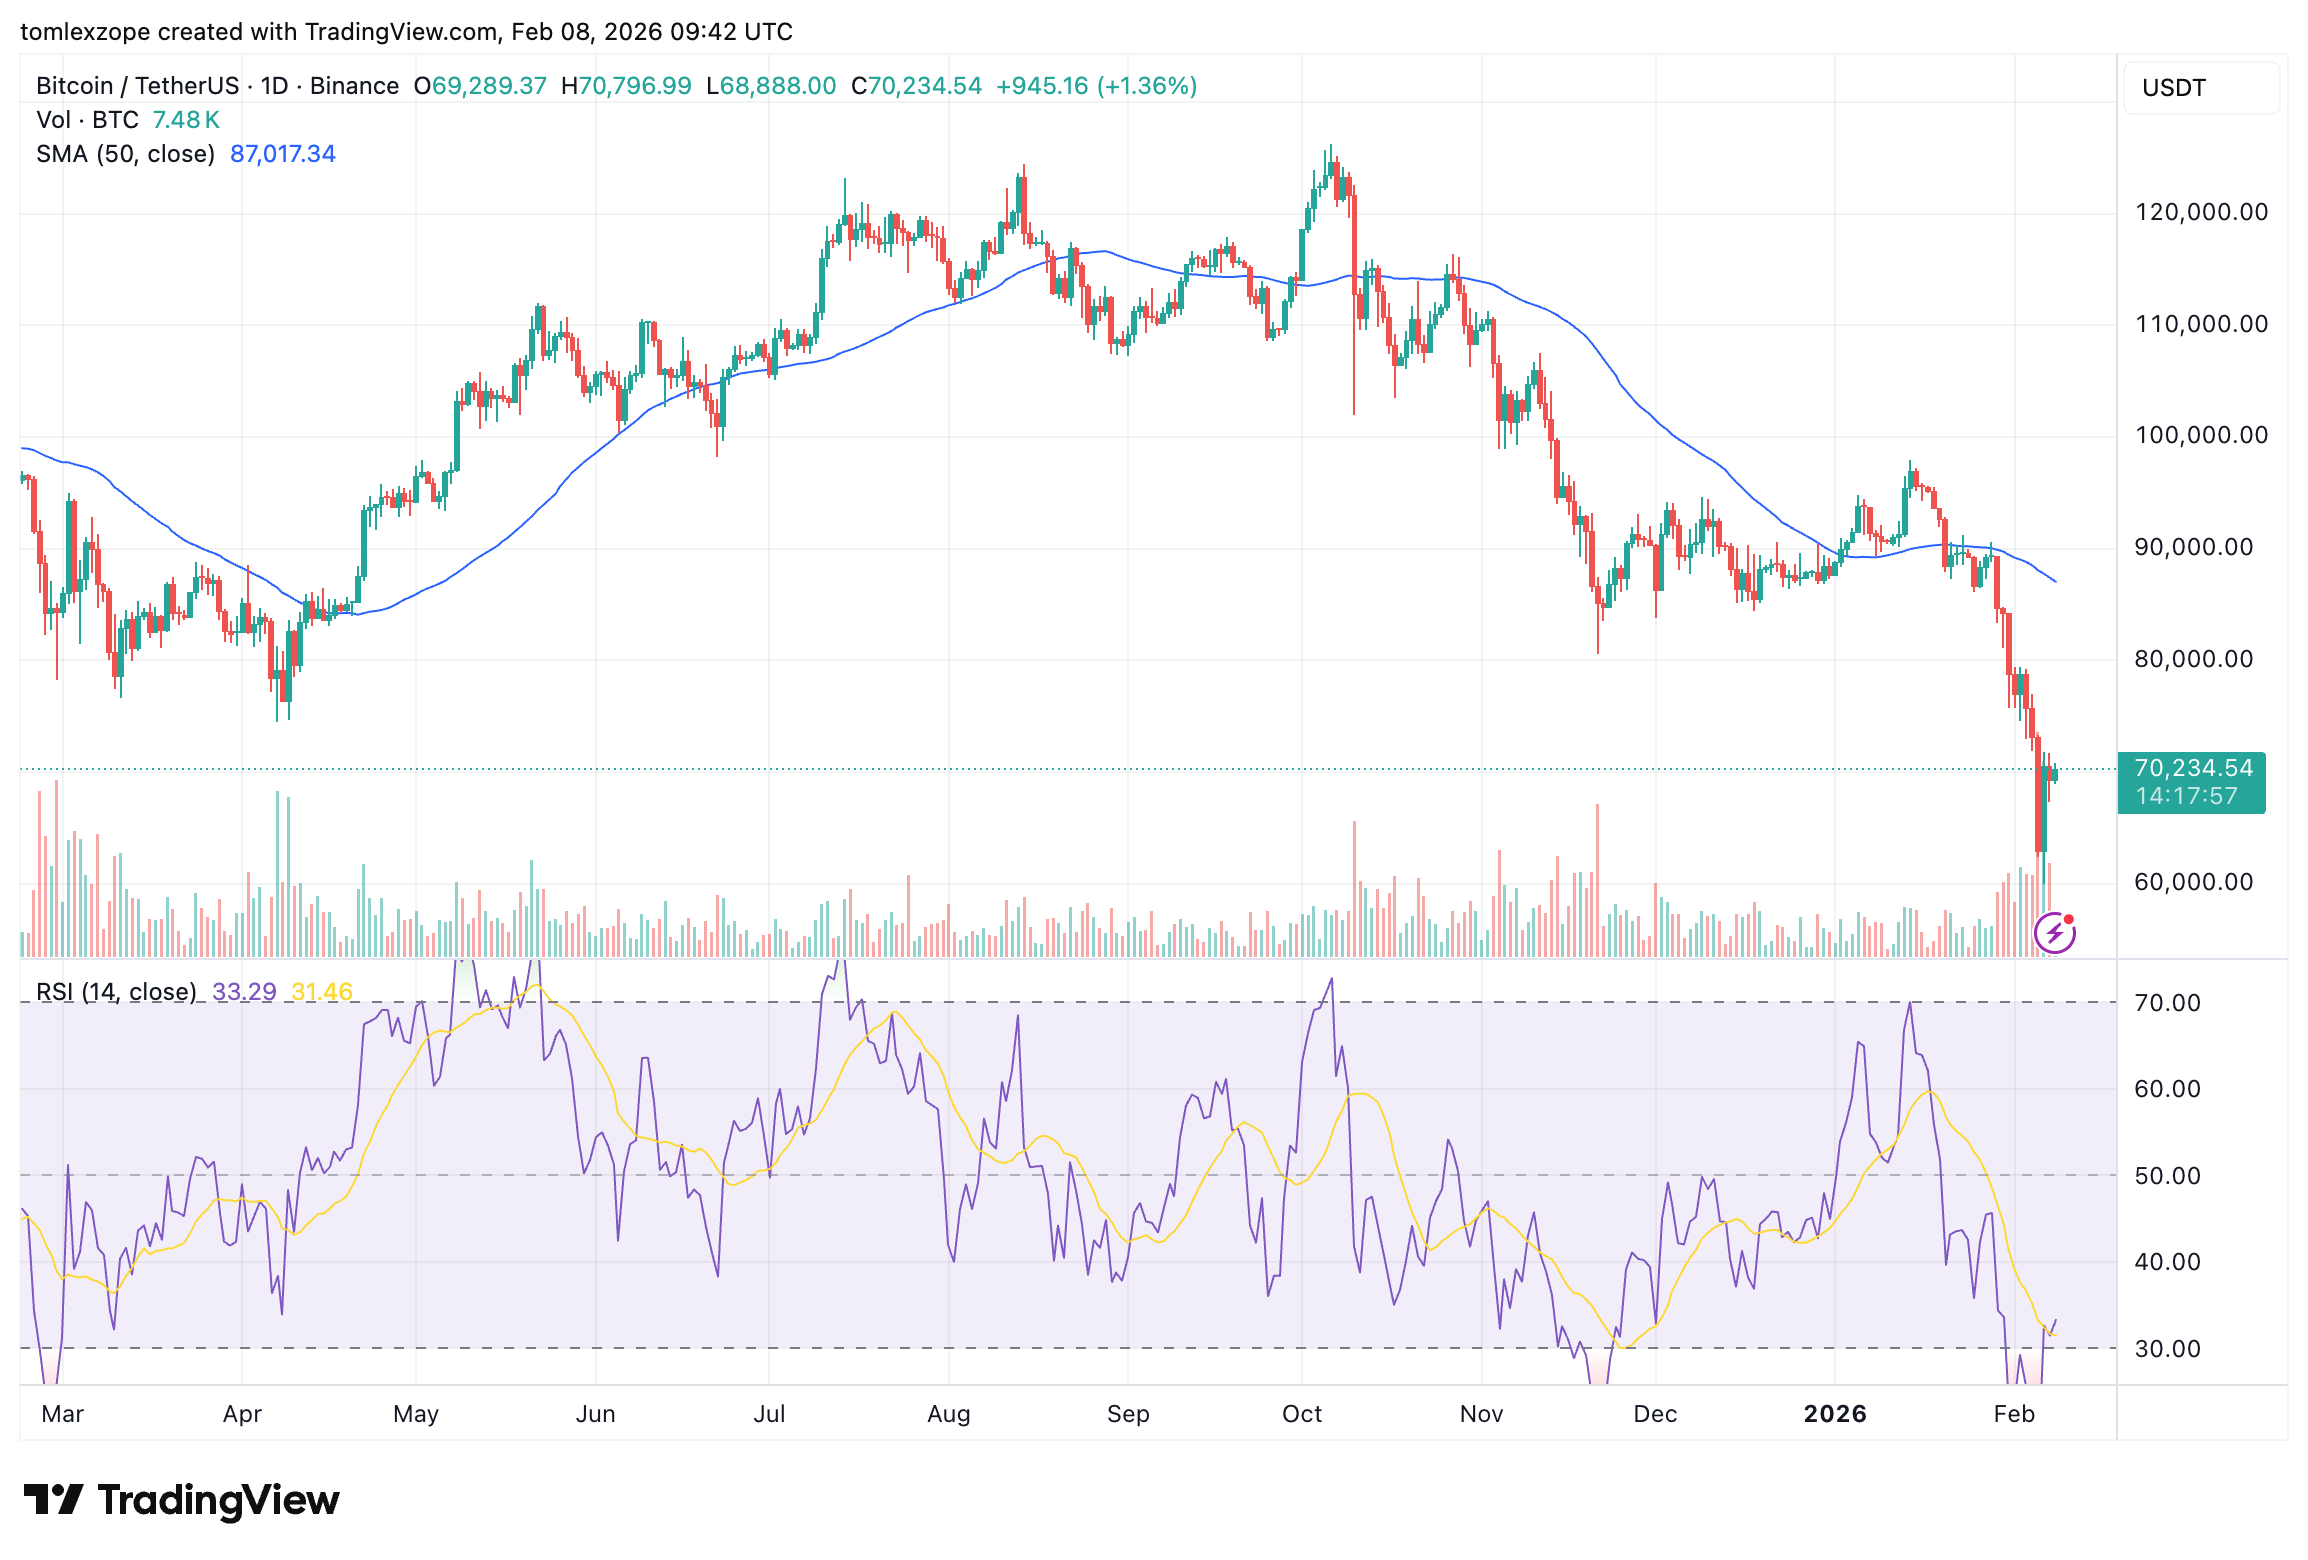
Featured image from iStock, chart from TradingView