XRP has entered what Korean certified Elliott Wave analyst XForceGlobal (@XForceGlobal) calls a “washout phase” within the broader Elliott Wave corrective structure – a zone that he believes could set the stage for renewed macroeconomic growth, with ultimate cyclical targets extending to the $20-$30 region.
In a February 3 video, XForceGlobal stated that the recent pullback does not change its broader framework, but rather pushes XRP deeper into what it described as an “alternative” macro scenario: an extended flat correction in which an earlier push towards fresh highs becomes a “false” attempt to flush out delayed buyers through a lower leg.
“There is nothing new here. We have been talking about this for a long time and we have two extreme points of interest,” he said. “Wave B creates a false breakout point at an all-time high, and then the current wave C, which we are also in, creates a false breakout point below the market structure of the previous low, which is wave A.”
XRP may require a final airdrop before $30
The core of his argument is based on the measured target for Wave C, derived from the pivot points of Waves A and B, in particular the Fibonacci extension of 1.618, which he characterized less as a mystical level and more as a behavioral indicator where corrections become emotional. According to him, Wave A is the initial move against the trend, Wave B is the “overconfidence phase”, and Wave C becomes a forced exit: stopping losses, violating a conviction and liquidation pressure.
“Essentially this is a trap and a sort of liquidation structure where Wave A is the first trend against the broader trend we expected,” XForceGlobal said. “And then wave B is the overconfidence phase, and wave C becomes a reality check where everyone who bought wave B at the top is now wrong and exits at the local lows due to their stop losses or simply losing confidence in the overall structure of XRP.”
He argued that because Wave C is driven by “emotion, not balance”, it tends to resolve as a five-wave decline rather than a three-wave correction, often ending around the 161.8% extension as a pressure sell-off. The key, he says, is not that assets become “cheap,” but that sellers run out of ammunition and divergences begin to emerge.
“The markets won’t turn around there because prices are really cheap,” he said. “It reverses because sellers are exhausted at these levels and you usually see sellers are really exhausted. You’ll start to see some bullish divergences.”
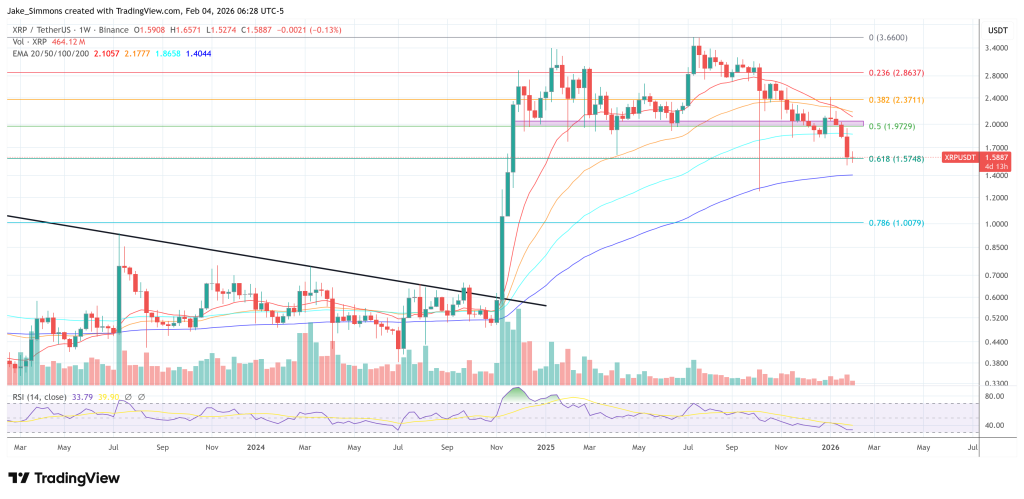
From a levels perspective, XForceGlobal described a volatile “free-for-all” zone where bulls and bears are fighting for a base, pointing to a range he pegged from around $1.50 down to $1.08-$1.09. He suggested that if the extended flat trend thesis is confirmed, this area could turn into a buying zone, but only after the five-wave down move has ended and this has been confirmed by a reversal sequence.
The macro context remains crucial to his conviction. XForceGlobal pointed to XRP’s breakout from the previous multi-year triangle and subsequent rally of approximately 500% as evidence of an objective five-wave rally followed by corrective structures consistent with an extended flat configuration: a non-impulsive pullback, a B-wave push to the extreme, and then a fresh extreme down below the prior market structure.
One of the most critical #XRP videos so far!
Complete 10-minute breakdown covering invalidation goals and levels. More importantly, I discuss how to properly manage expectations amid chaos using a macro framework, and why the overall trend remains bullish. pic.twitter.com/E2g9ga52N9
— XForceGlobal (@XForceGlobal) February 3, 2026
If XRP completes the recovery stage and enters what he described as a fresh impulsive cycle, with the classic wave three, wave four and wave five sequence, its roadmap will open up higher goals over time. “Here we are creating wave three, wave four, and then wave five, which is underway and which could take us to the $20-$25, $30 region that we are looking for at a later stage,” he said.
He also flagged $6 as the main level at which he expects profit-taking and reassessment, viewing it as part of a broader risk management approach rather than a one-off price call.
At press time, XRP was trading at $1.5887.
Featured image created with DALL.E, chart from TradingView.com