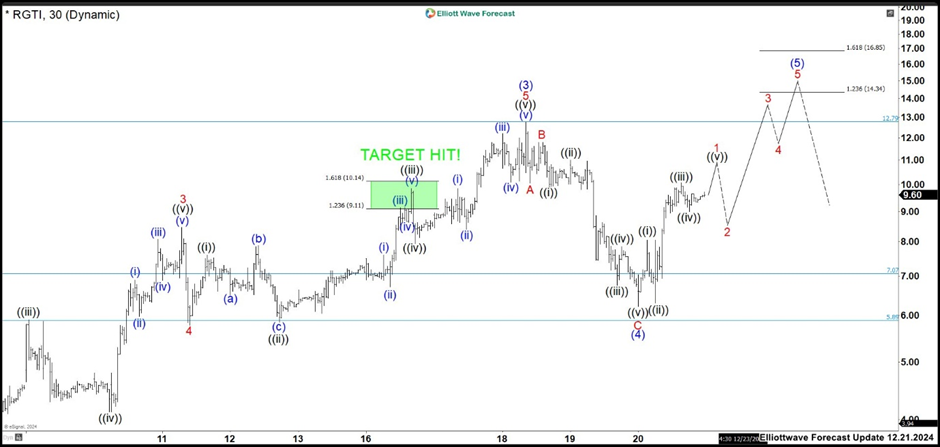
RGTI’s value has skyrocketed in recent days, attracting investor attention. Here we have a 15-minute chart. Applying the Elliott wave principle, the stock should find support in the area of 5.89 – 7.07 to complete wave 4. This would generate a novel rally in wave 5, which could reach around 8.94 – 10.25 or extend higher.
RGTI Chart 15 Min. 12/11/2024
In any case, as long as the market respects the 5.89 – 7.07 area, RGTI needs to continue its upward movement and break wave 3 to reach at least 8.94 – 10.25. If the market closes below 5.89, it opens up the possibility of the stock falling to 4.00 before looking for another move up.
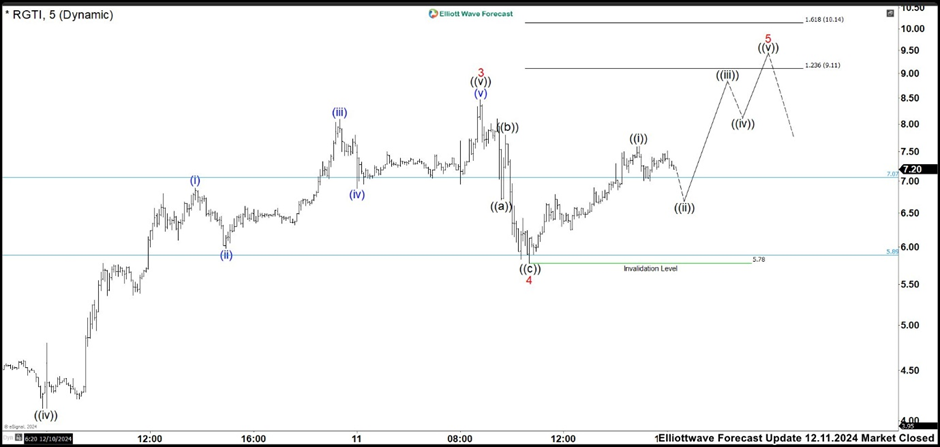
RGTI Chart 5 Min. 12/11/2024 (Market Closed)
RGTI found support at the low of 5.78 and rebounded. Hence we want to build an impulse structure in the form of wave 5. Wave ((i)) may already be over and although the pullback in the form of wave (ii)) is above the low of 5.78, the RGTI should continue to rise. The target for this wave 5 is between 9.11-10.14 if there is no further extension of the rally.


