This article is also available in Spanish.
In analysis published on TradingView, pseudonymous cryptocurrency analyst Melika Trader provided a technical forecast for Cardano (ADA), highlighting a long-term upside scenario with a price target of $1.8. Using chart patterns and key price levels, Melika offers both brief and long term perspectives on ADA price movement.
Cardano long term price forecast
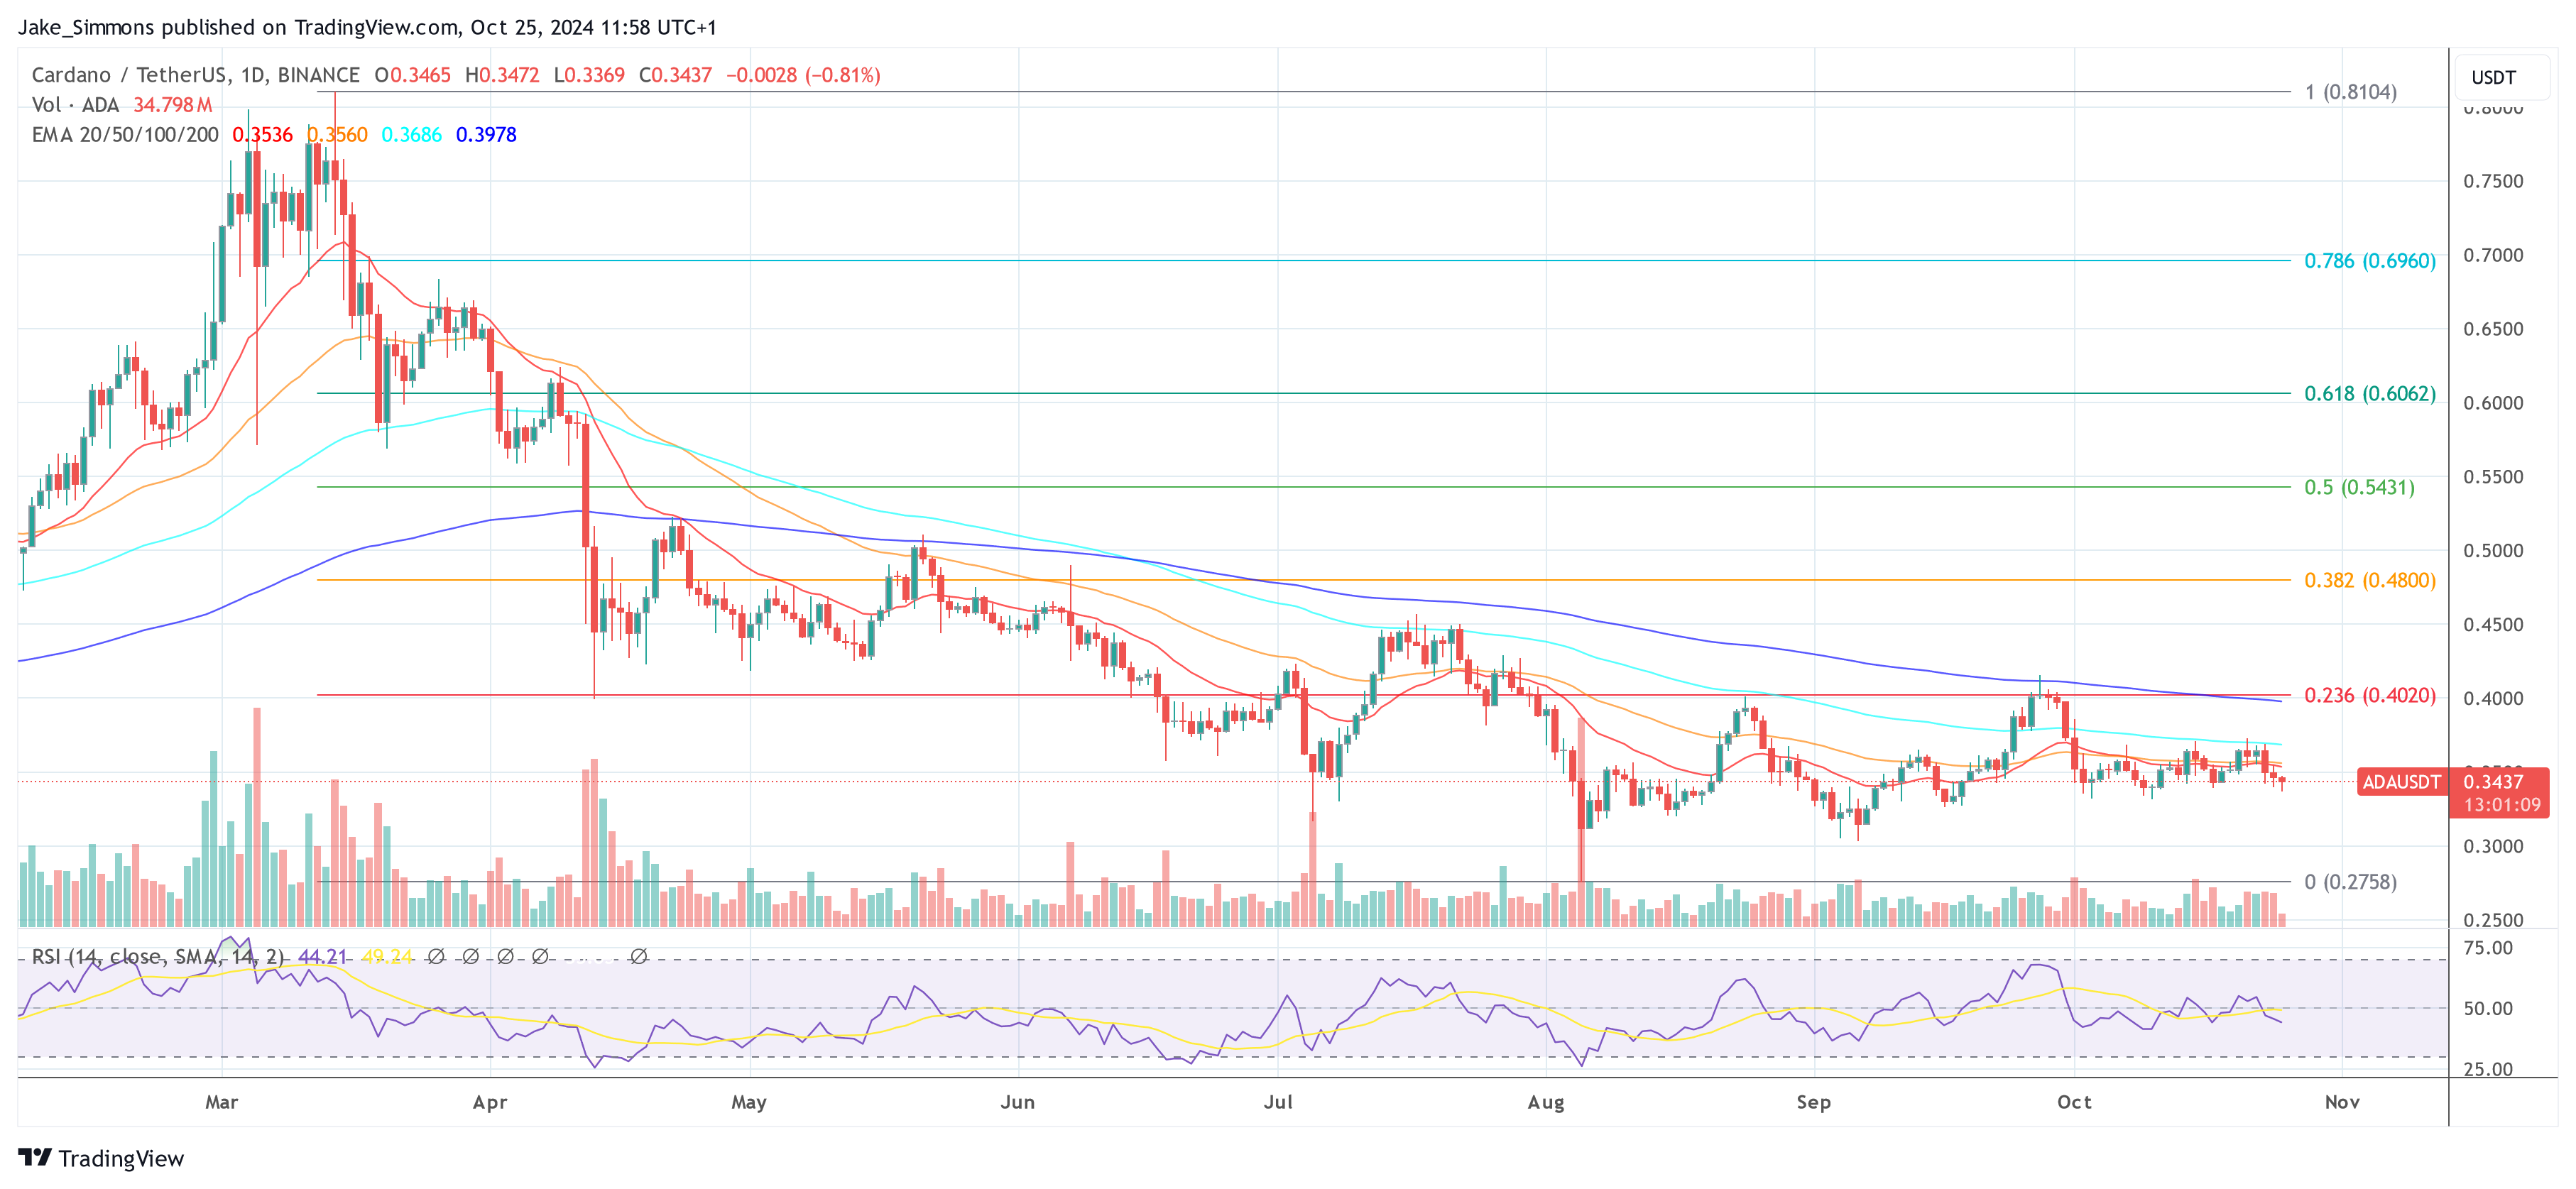
Melika identifies a significant support zone for ADA between $0.30 and $0.35. This range has historically shown sturdy buying interest, characterized by a covering candle pattern and pre-established supply and demand (S&D) zones. This base pattern suggests a solid floor where Cardano has been consistently gaining market support.
The analyst points to the potential for a bullish reversal, noting that ADA’s price action appears to be forming a bottom in this support zone. “The price appears to be forming a bottom after breaking above the support area, indicating a potential bullish reversal,” Melika states.
Looking ahead, Melika has a long-term resistance target of $1.20-$1.80. This target area is not arbitrary, but is based on previous price highs, making it a significant headwind for future price action. If ADA maintains its support base, a path to higher resistance levels could be realized as buyer confidence rejuvenates, setting the stage for a potential bull market.
“The next major resistance is in the $1.20-$1.80 zone, marked as a long-term target, which is in line with previous highs. If current support continues, ADA may be poised for sustained growth toward its long-term goal, especially as buyers regain confidence,” writes Melika.
However, it also warns investors of a bearish scenario in which ADA fails to maintain the $0.30 support level. A breach below this threshold could lead to a drop below $0.18, which poses significant risk to holders. “Failure to maintain support around $0.30 could result in a retest of the price below $0.18,” Melika warns.
ADA Price Analysis: A Short-Term Perspective
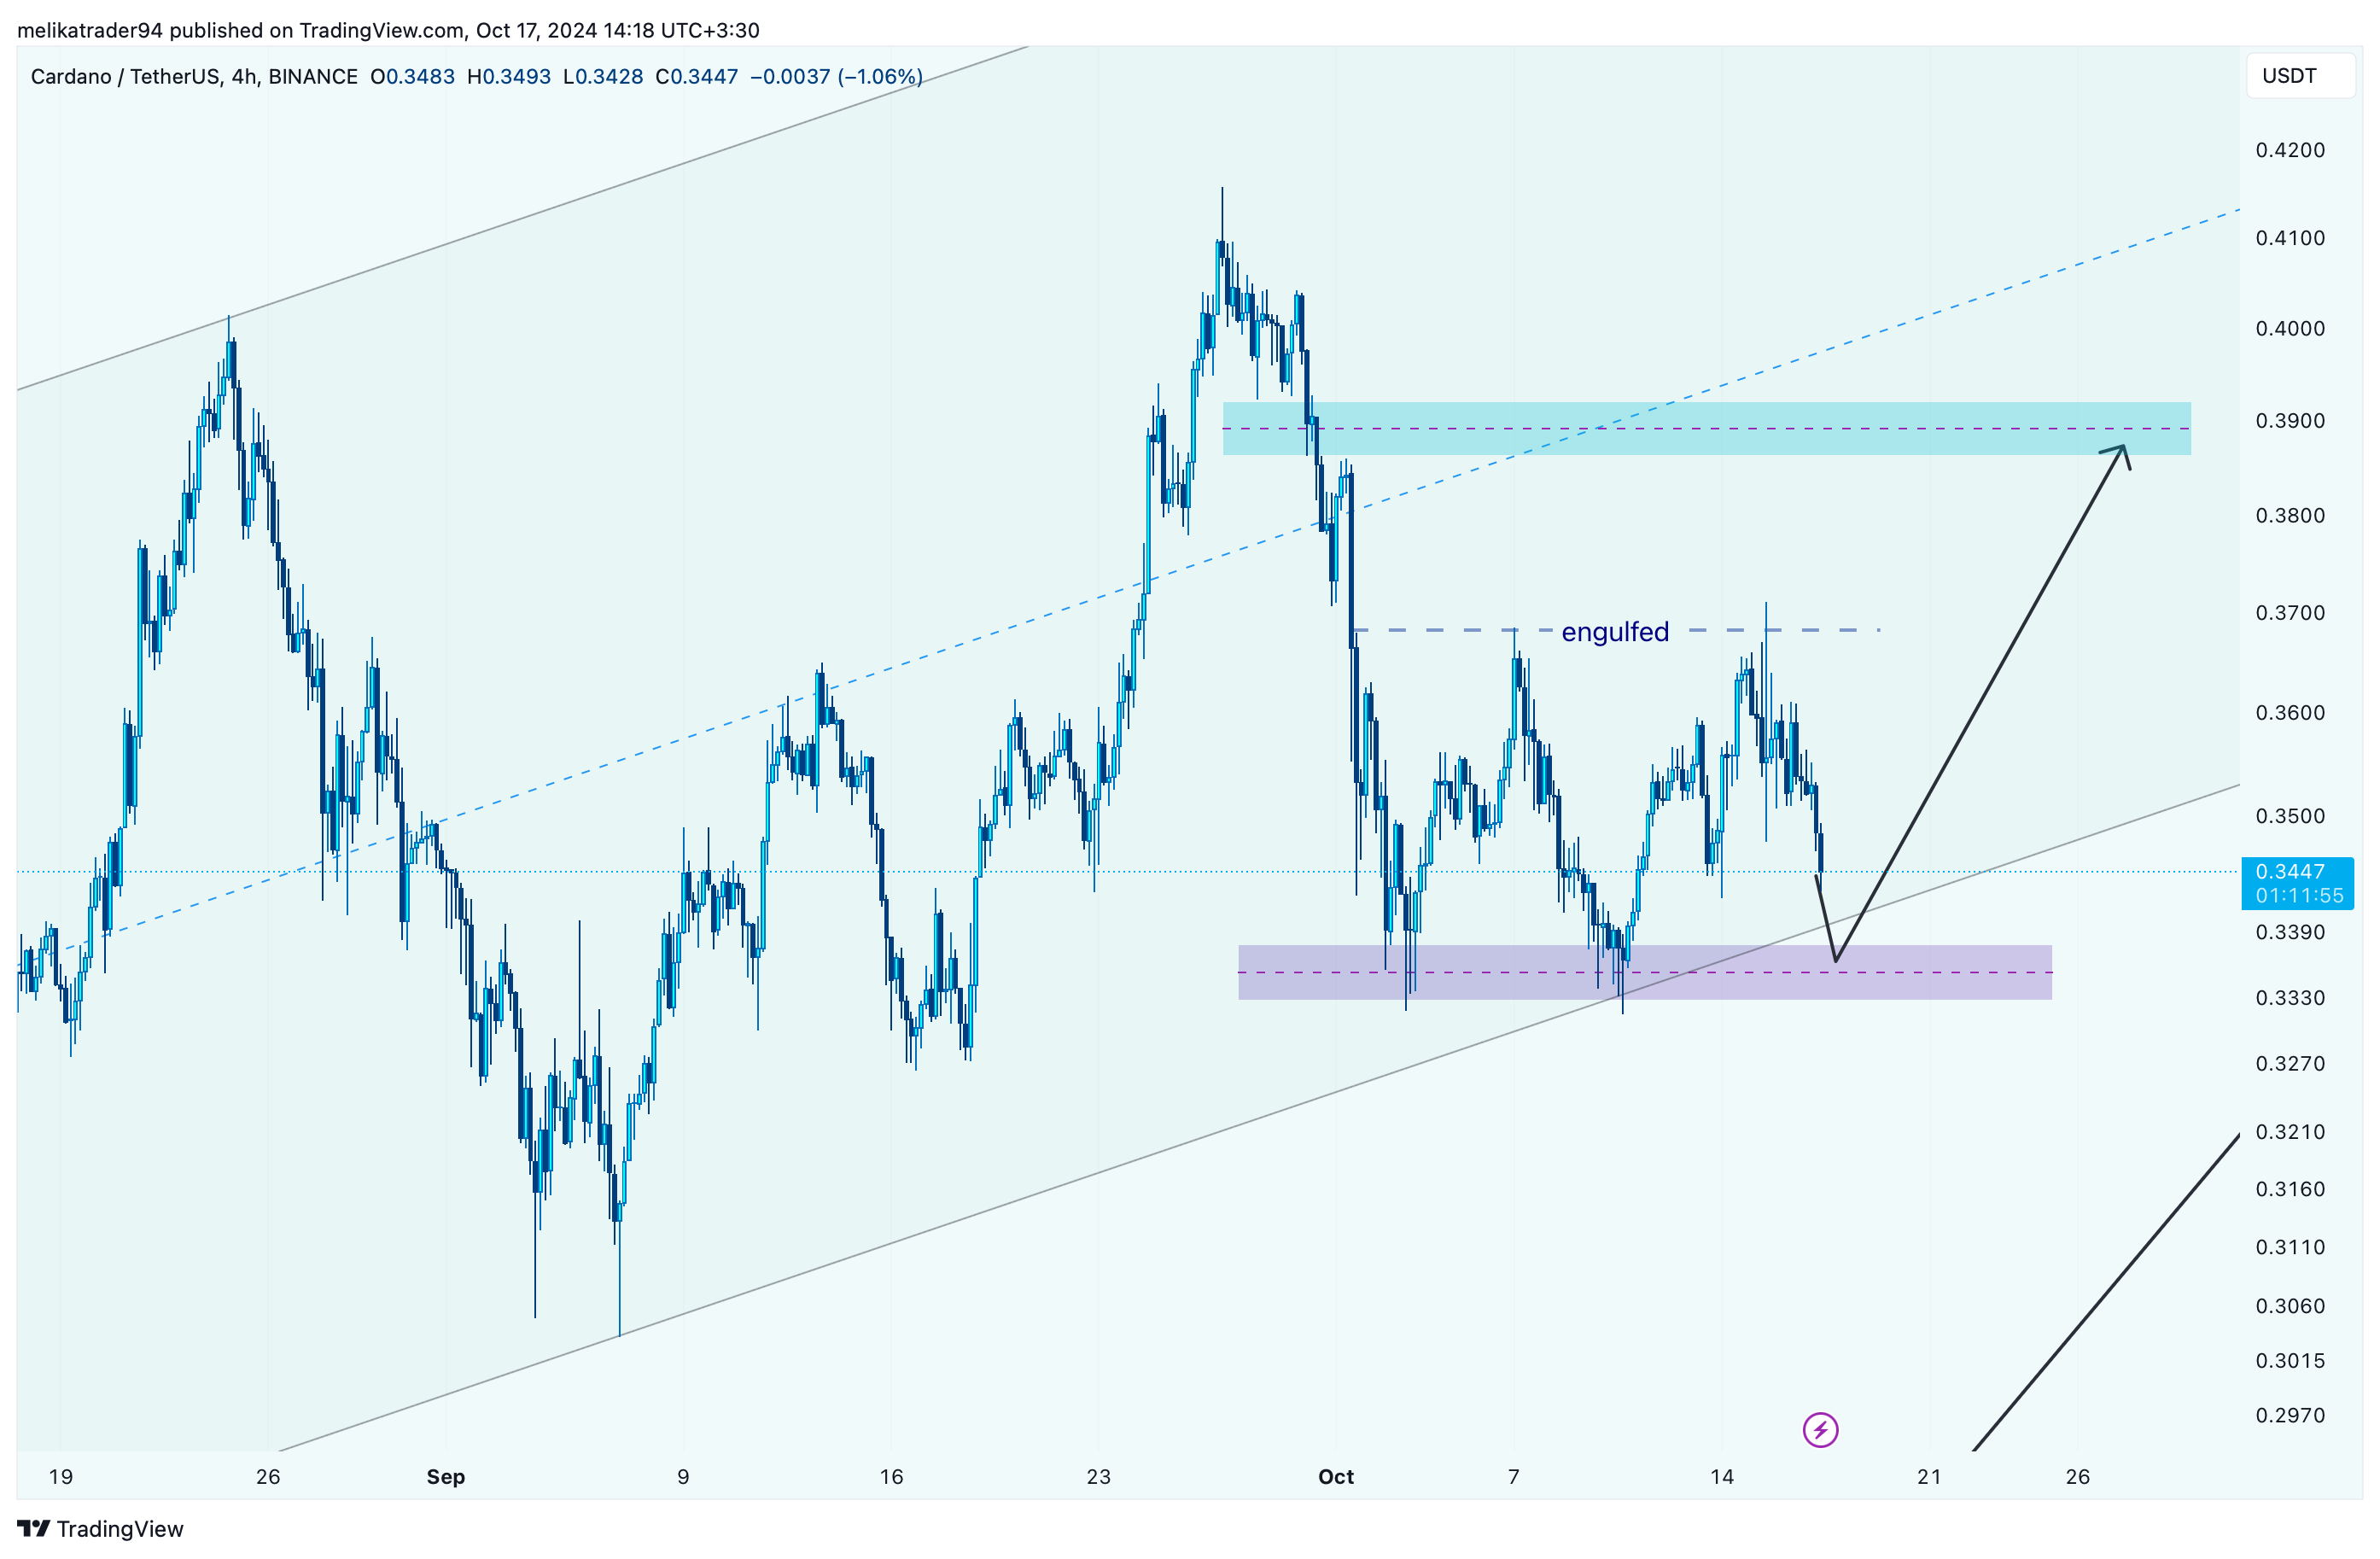
In the near term, ADA is moving in a sturdy support zone identified between USD 0.33 and USD 0.34, consistent with a lower trend line that highlights its importance. “A rebound from this support zone could see ADA target the $0.38-$0.39 resistance zone. The engulfed area suggests a possible reversal signal,” says a cryptocurrency analyst.

This resistance zone at $0.39 represents a critical point where previous sellers have previously dominated, making it a key area for short-term ADA price action. A successful break of this resistance may confirm the bullish rebound scenario. “The $0.39 zone is a significant resistance where sellers have previously controlled the market, making it a critical area to watch for a possible breakout,” Melika states.
Conversely, if ADA fails to maintain current support, the price could move back towards broader long-term support at $0.30, confirming the downside risk that Melika highlighted.
At the time of publication, ADA was trading at USD 0.3437.

Featured image from Shutterstock, chart from TradingView.com
