- The US Dollar Index is sending signals that the trend may change and the value will enhance.
- The weekly and daily charts show bullish Japanese candlestick formations after recently touching the support level of 100.
- The 4-hour chart indicates the possibility of a recent, short-term uptrend forming.
The U.S. Dollar Index (DXY) has bounced off support at the bottom of its multi-year range and has formed some reversal patterns that indicate a possible reversal of the bearish move down from the July highs. Overall, however, it is still a bit too early to say for sure and there is a risk that bears could take over again and push the price back down.
US Dollar Index Weekly Chart
DXY has formed an unconfirmed bullish Piercing Line Japanese candlestick pattern (shaded rectangle) on the weekly chart at the historical support level at 100. This level has been tested multiple times in the past (orange bubbles).
Piercing line pattern is formed after a down move when a red candle is followed by a green candle that closes above the midpoint of the initial red candle. This is a sign of a bullish reversal. However, for confirmation, the pattern should be followed by another green candle that cannot be verified until the end of the current week.
The Relative Strength Index (RSI) emerged from an oversold position last week, triggering a buy signal and providing additional evidence of a possible bull run.
Dollar Index Daily Chart
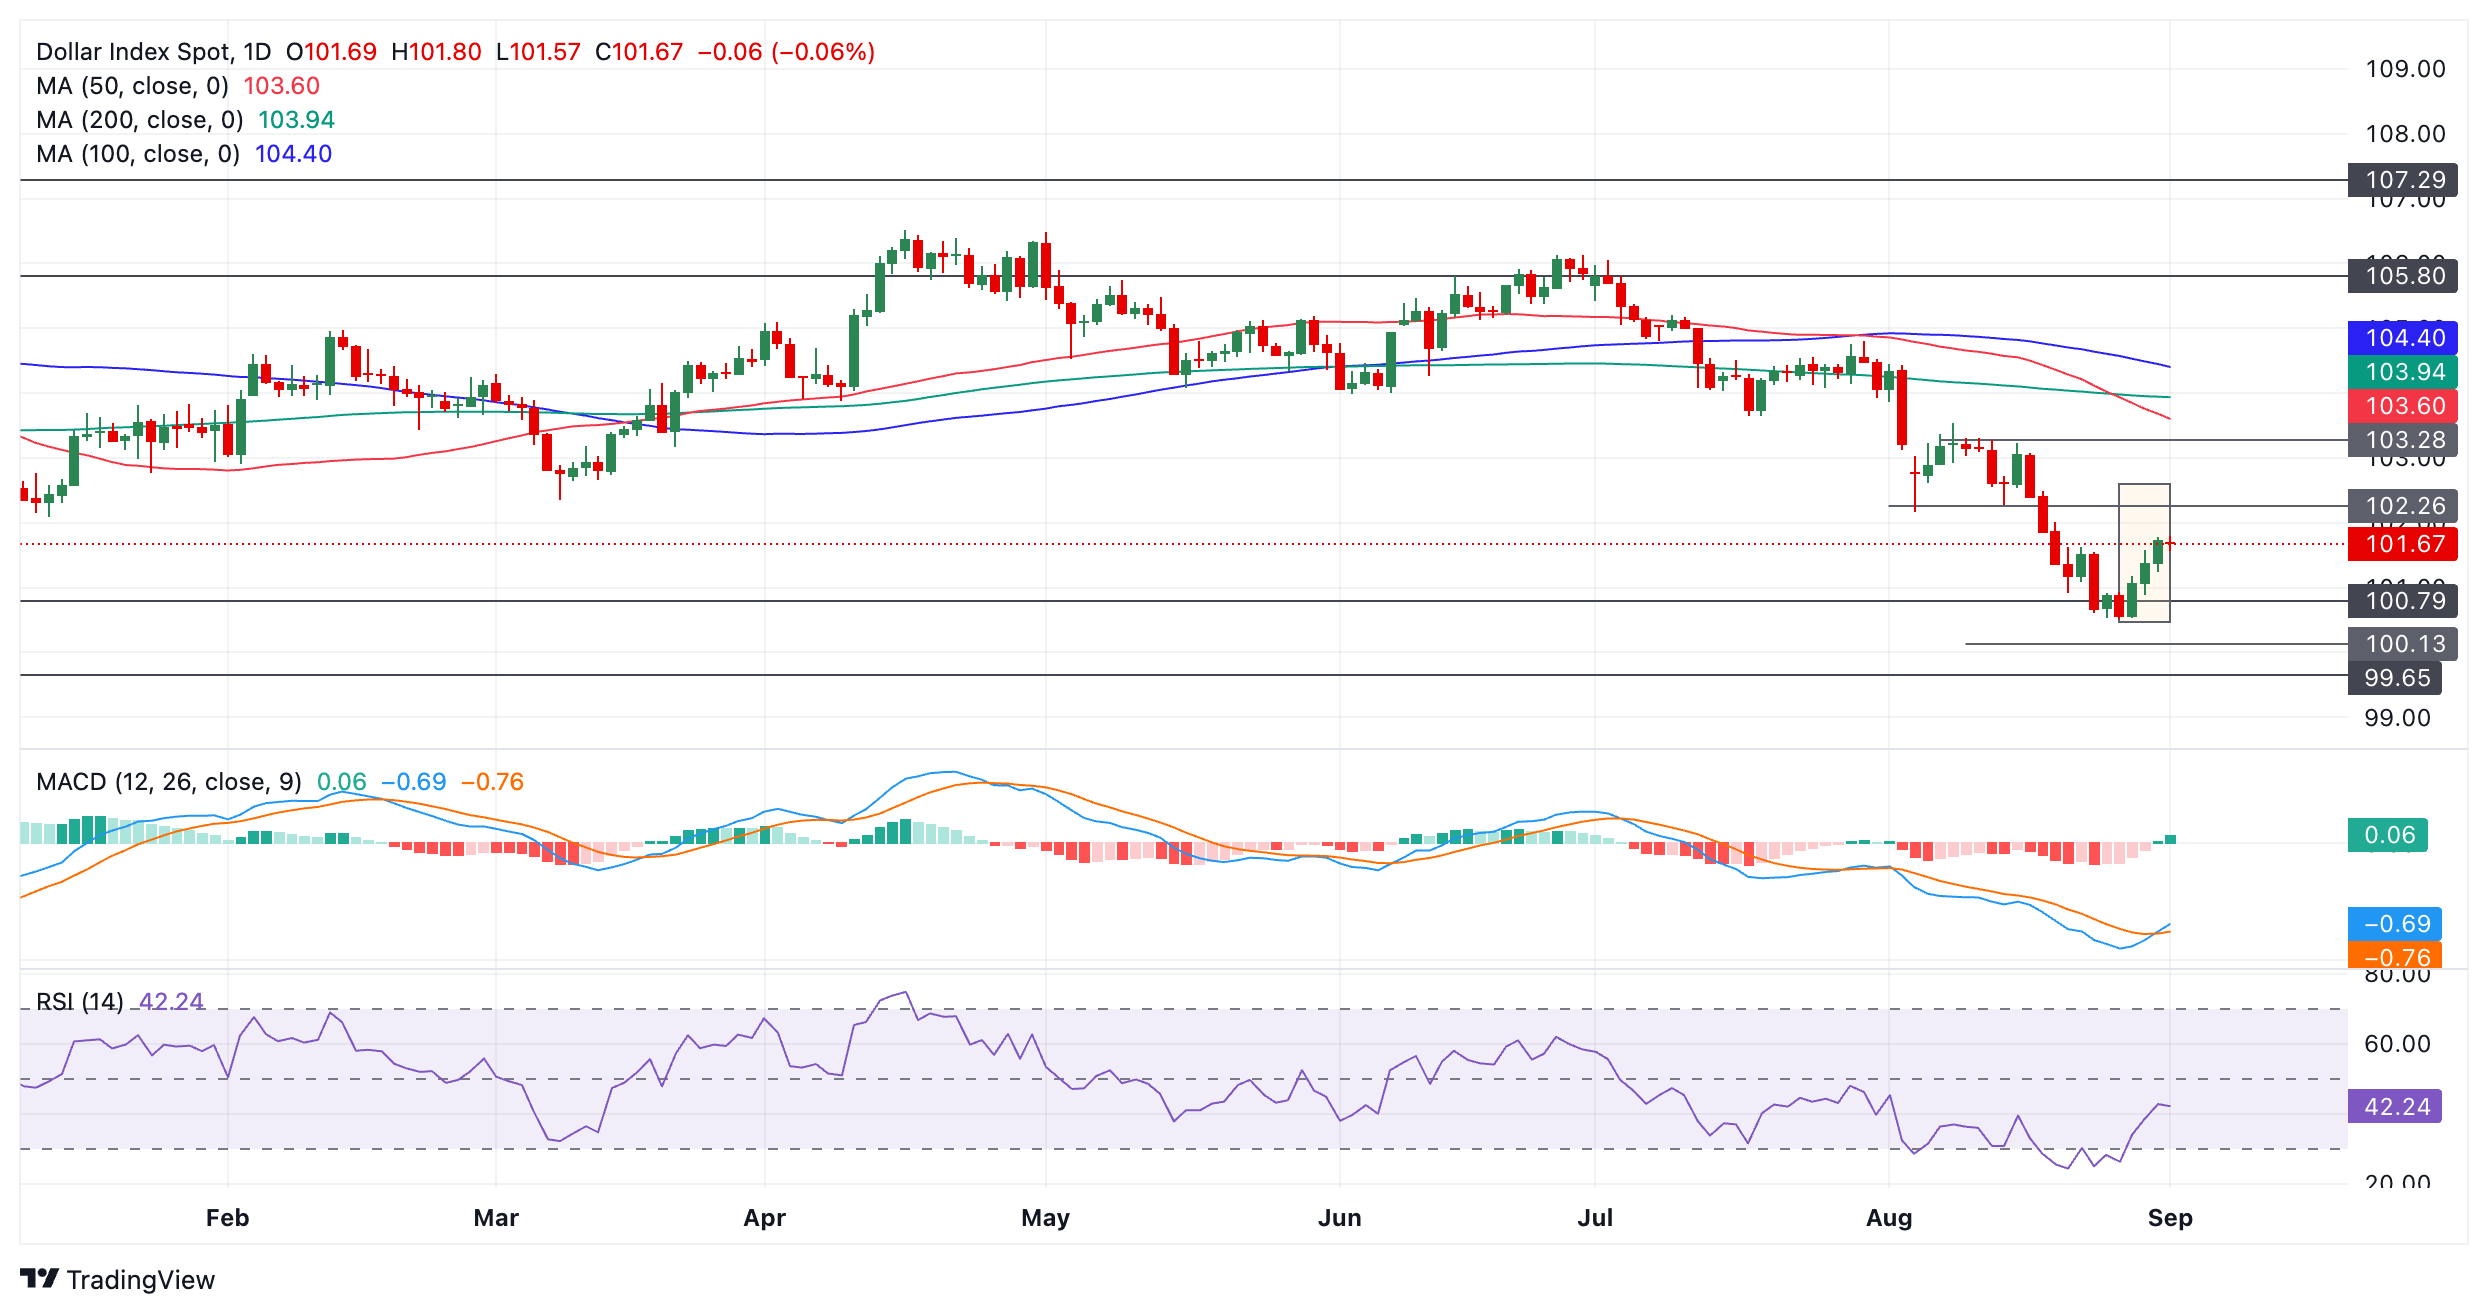
The daily chart of the DXY shows that a Three White Soldiers Japanese candlestick pattern has formed during the bounce over the past three days. This pattern forms after a market bottom when three rising green candles form in a row of similar size. This is a bullish reversal sign.
The Moving Average Convergence-Divergence (MACD) oscillator has broken above its red signal line, providing further evidence to support the bullish hypothesis.
The RSI indicator recently came out of an oversold position, giving a buy signal.
Dollar Index 4 Hour Chart
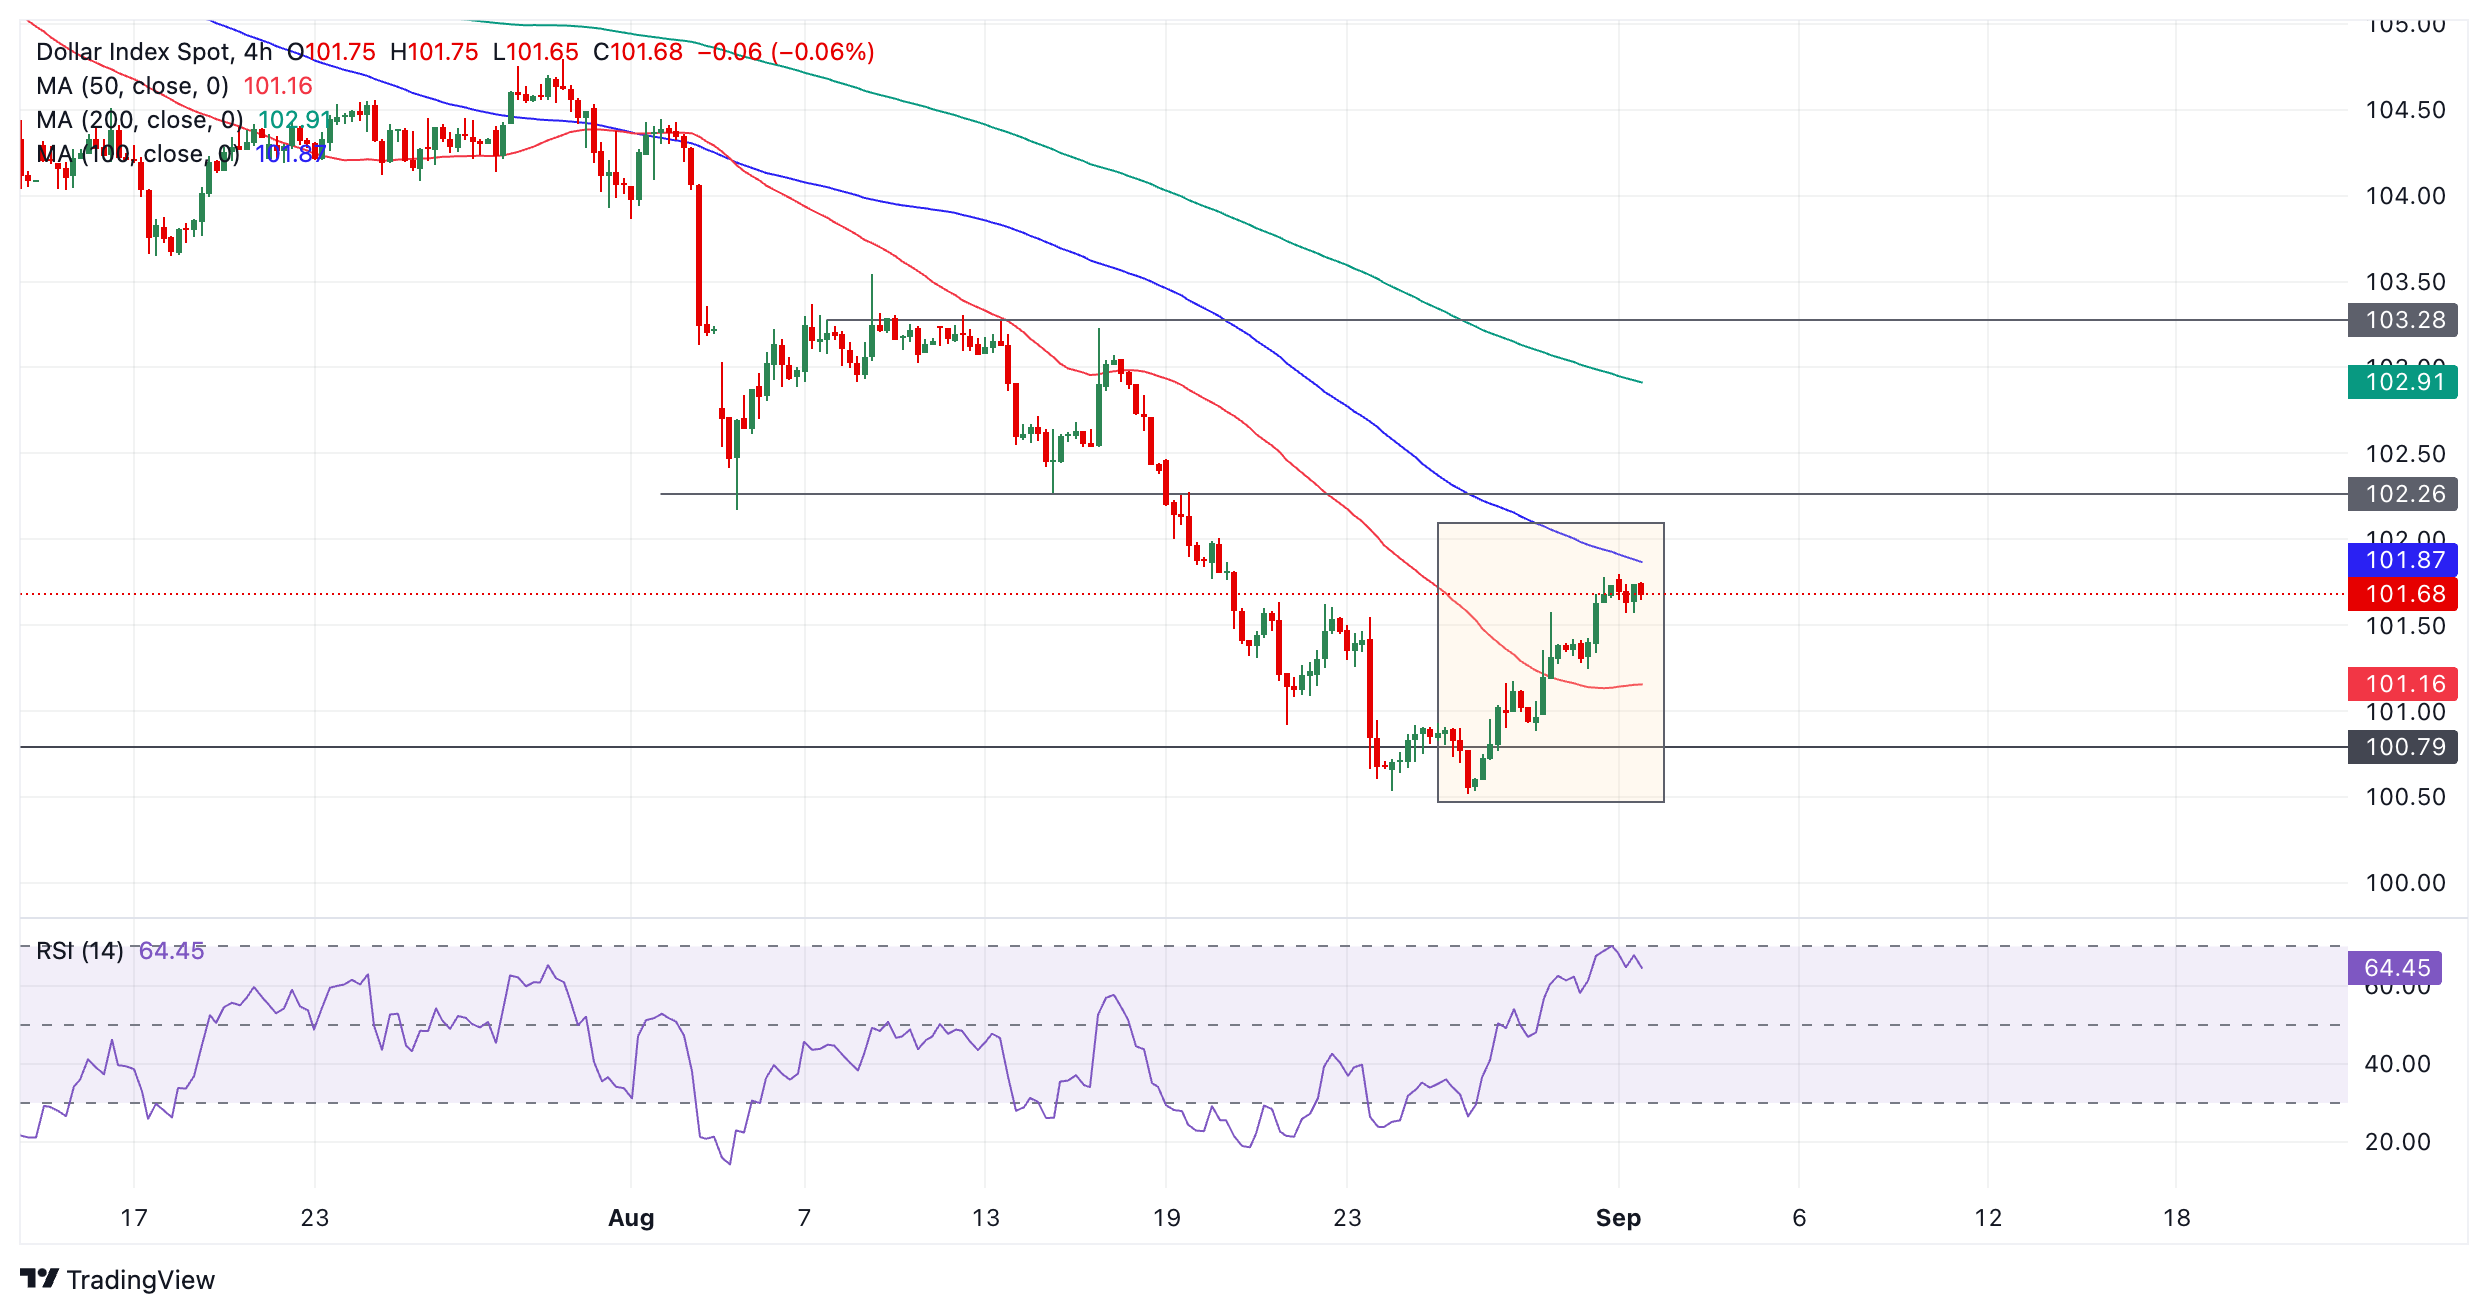
The 4-hour DXY chart shows a possible recent uptrend forming (shaded area). The sequence of highs and lows is now rising, suggesting that the near-term trend may be bullish. DXY has also broken above the key high of August 22.
Considering that “the trend is your friend”, this could indicate an evolution of higher highs, with the next target at 102.26 (August 14 low).
The RSI has just emerged from the overbought region, which increases the risk of a deeper correction.