After Bitcoin’s price surge to $64,000, cryptocurrency analyst Rekt Capital is predicting a significant breakout move in the coming weeks. In a up-to-date video The analysis found that the analyst is forecasting significant market moves around October 2024, based on historical precedents and current chart patterns.
Will October be a bull market for bitcoin again?
Looking at the weekly chart, Rekt Capital identifies a descending channel. For the past four weeks, BTC has been deviating below this channel, looking for support that would allow price expansion above the channel bottom. This move was met with a “fantastic bounce,” signaling the potential for a return to the channel top at around $67,000 in the coming weeks.
“The bounce from the channel bottom is key because historically, the price has averaged about two weeks from the channel bottom to the top,” Rekt Capital explained. He emphasized the importance of weekly candle closes above specific levels, particularly at $67,500 and ultimately at $71,500, which would indicate a breakout from the high reaccumulation range established after the halving.
“A consistent pattern of bouncing from the bottom of the channel to the top usually lasts an average of two weeks, but in the current context, we see a potentially extended consolidation phase at these lower levels,” Rekt Capital explained. This observation suggests that while the bouncing trajectory follows historical patterns, consolidation at lower prices could provide investors with opportunities to buy at bargain prices.
Focusing on technical thresholds, Rekt Capital emphasized the criticality of multiple weekly candlestick closes above key price points. First, a close above $66,000 would reconfirm the lower end of the reaccumulation range as newfound support, setting the stage for further upside. More importantly, a decisive weekly close above $67,500 would signal a breach of the persistent lower highs trend that has been dominant since March of this year.
“The weekly close above these particular levels is not just a technical achievement but a psychological victory for market participants, indicating that selling pressure has eased and the upside momentum has been regained,” Rekt Capital noted.
Historically, Bitcoin has tended to initiate major rallies around 150 to 160 days after a halving. Referring to the 2016 and 2020 halvings, the analyst suggested that similar conditions are currently forming, with Bitcoin around 133 days after its last halving.
“This cyclical observation aligns well with the current market dynamics, where Bitcoin has been methodically testing and in some cases breaking important technical barriers,” he noted. This comparison is based not only on time patterns, but also on the qualitative nature of market behavior during these periods.
The 21-week EMA, a key indicator often considered a bull market barometer, was a key point of analysis. Rekt Capital highlighted its historical significance, noting that “Deviations below the 21-week EMA in bull markets typically offer lucrative buying opportunities, as seen in the 2021 cycle. Bitcoin is currently hovering around this EMA, providing mixed signals that require careful interpretation.”
Looking ahead, analysts predict that for Bitcoin to begin a up-to-date parabolic phase leading to price discovery and potentially up-to-date all-time highs, it must first consolidate above the $71,500 level — representing the top of the reaccumulation range. This level has previously acted as a formidable resistance, and a weekly close above it would likely catalyze a major bull phase.
“What will matter most in the coming weeks is the market’s ability to hold these critical supports and break through resistance levels with conviction. This will determine the feasibility of a breakout consistent with historical post-halving patterns,” Rekt Capital concluded, suggesting that October could be key for Bitcoin’s trajectory.
At the time of going to press, the BTC price was $63,956.
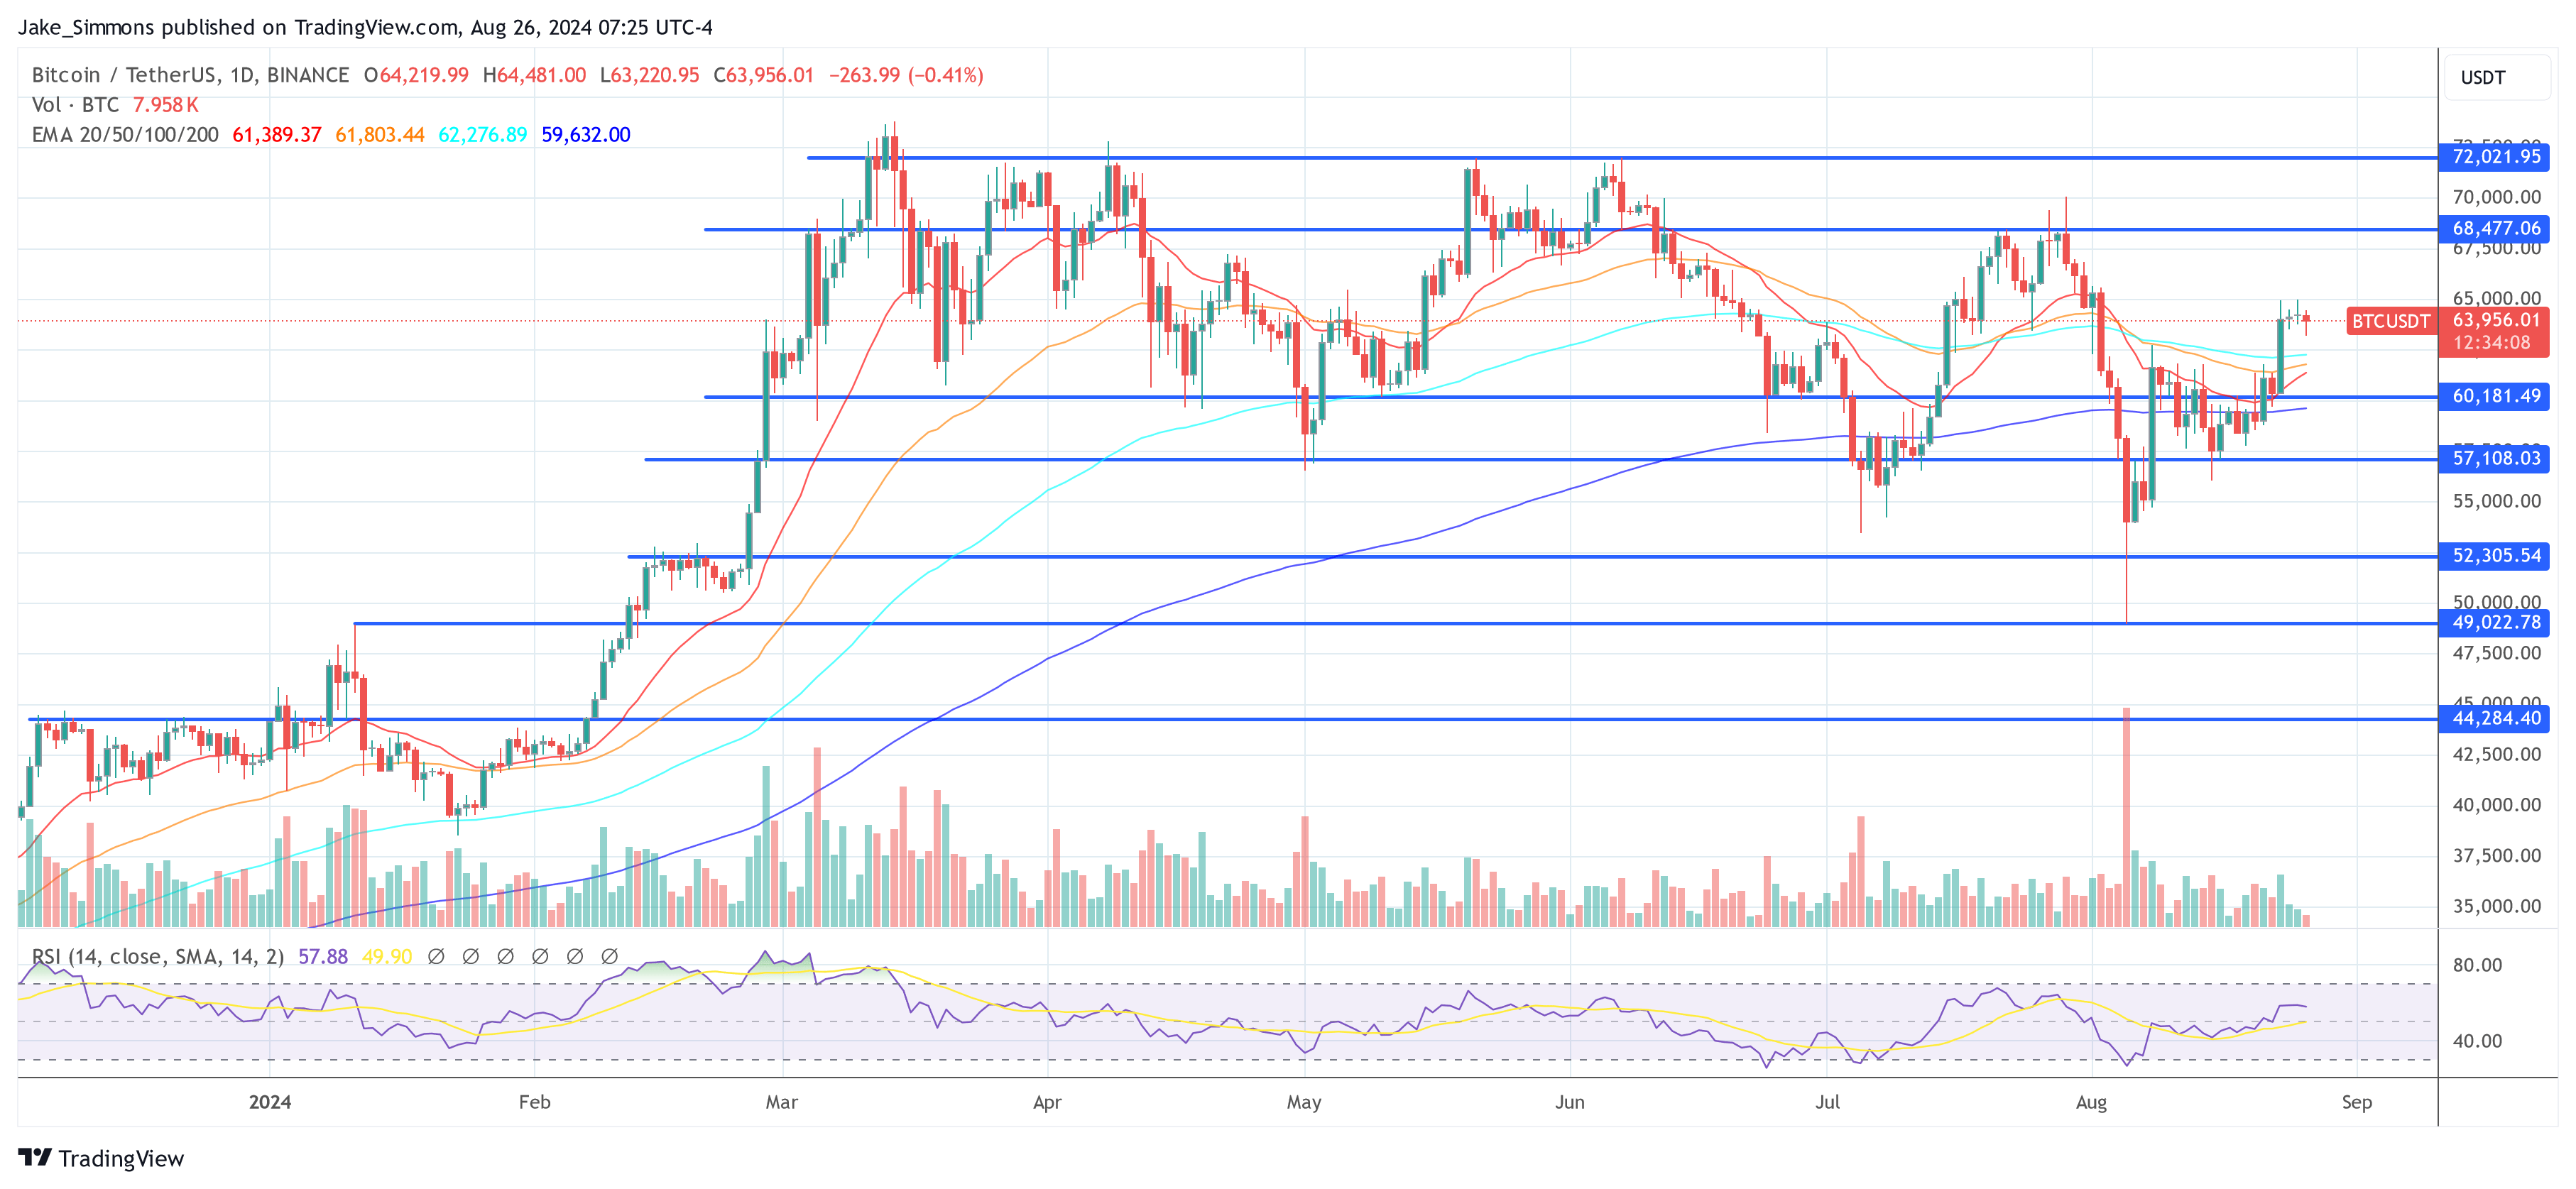
Featured image created with DALL.E, chart from TradingView.com