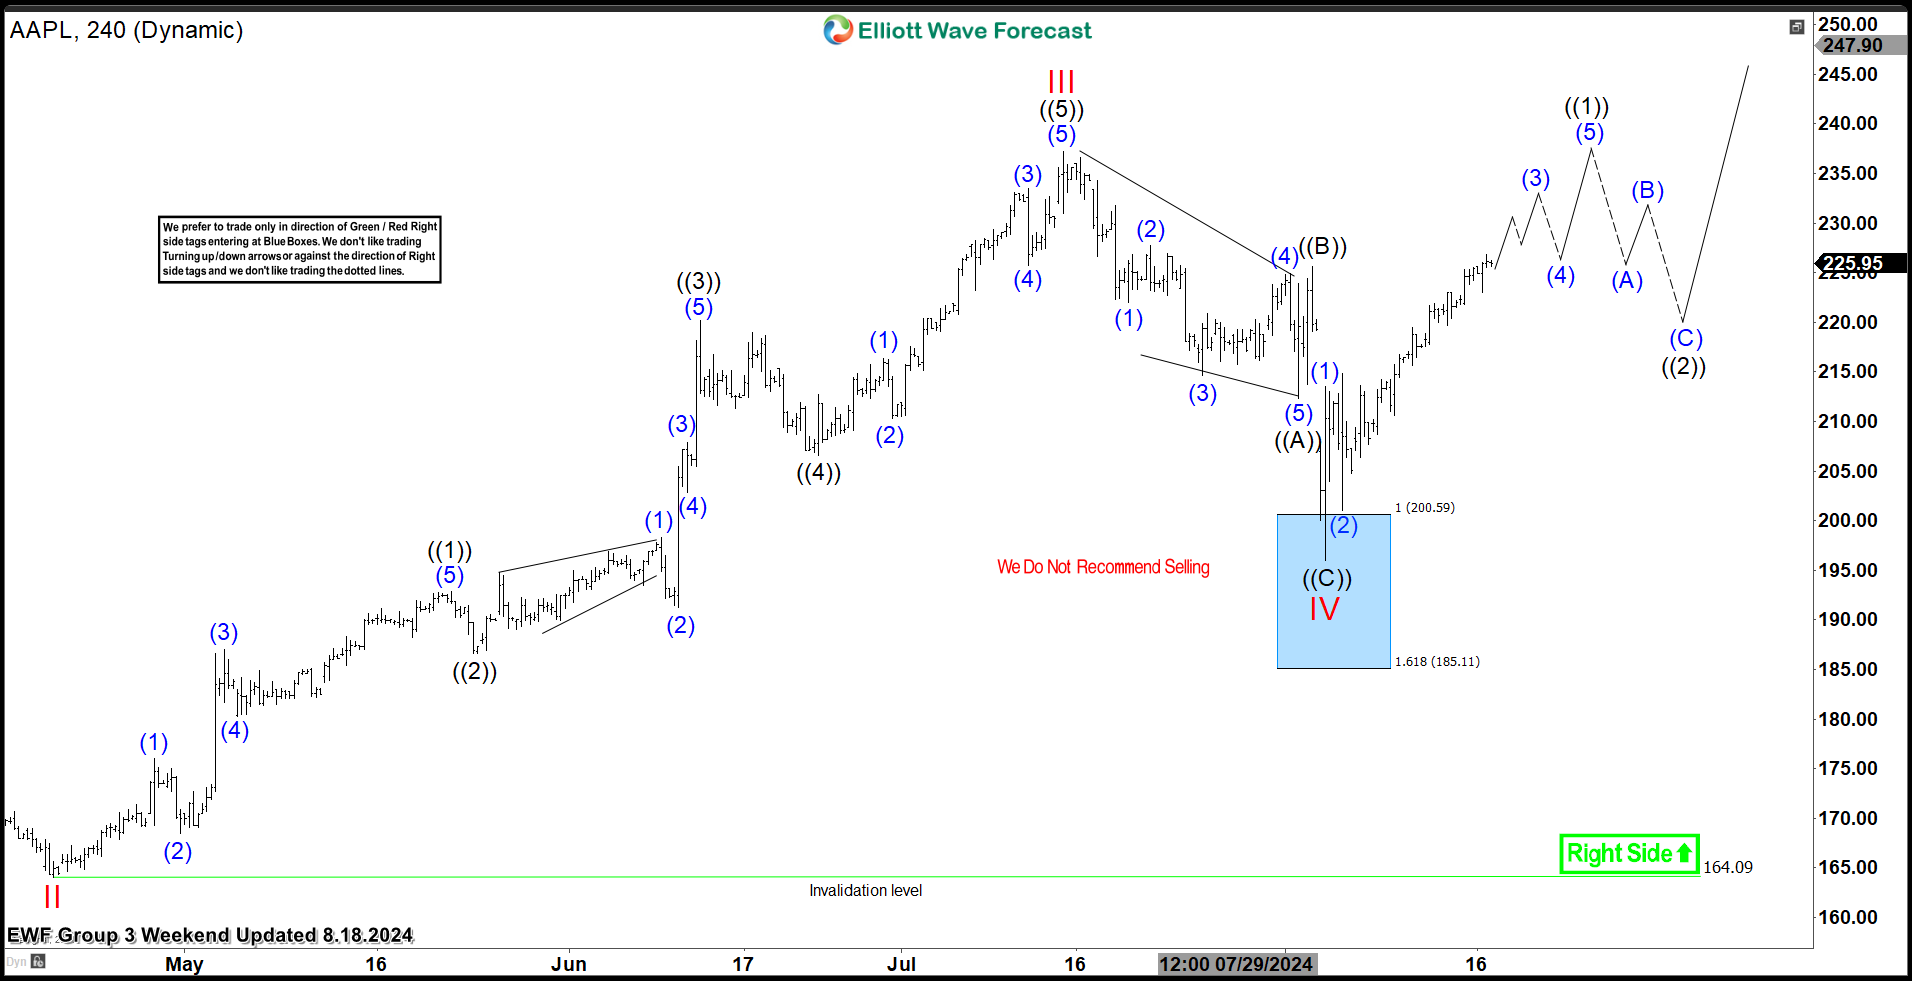
In this technical article, we will take a quick look at the weekly Elliott Wave charts of Apple (AAPL) stock, as published in the members area of the site. As many of our members know, this stock has recently given us some good buying opportunities. AAPL has entered our Buy Zone and has completed a correction at Equal Legs (Blue Box area). In the following sections, we will delve deeper into the Elliott Wave pattern and our trade setup to gain more insight.
AAPL H4 Update 08.05.2024
The stock has given us a correction from the low of 164.19. The pullback has already reached
extreme zone (Blue Box) and giving us a reaction from there. At this stage we advise not to sell
stock and favor the long side from the marked H4 Blue Box area. AAPL could either see a rally to a modern
highs or larger corrective bounce in at least three waves.
Quick reminder:
Our charts are designed with simplicity and ease of trading in mind:
▪ Red bearish tick + blue box = Preparing to sell
▪ Green bull sign + blue box = Buy setup
▪ Charts with black ticks are considered non-tradable.
AAPL H4 Update 08.18.2024
The stock responded exactly as expected in the Blue Box Area, attracting buyers and initiating a significant rally from our recommended buy zone. We would like to see a breakout of the III red high to confirm that the next leg of growth is underway.
To fully leverage these opportunities and stay ahead of the competition, consider using our expert services and insights.

