Cryptocurrency analyst @Ripple_Effect11 predicts an imminent price crash for XRP in a modern technical analysis shared via X. His prediction is supported by a bearish breakout from the main triangle pattern that forms from $3.84, an all-time high on January 4, 2018. The analysis paints a bleak picture for XRP in the coming months, with a potential drop to as low as $0.07, depending on certain technical events.
Why XRP Price Could Drop to $0.07
Elliott Wave Theory, which underpins @Ripple_Effect11’s analysis, is a form of technical analysis that predicts future price movements by identifying recurring wave patterns related to investor psychology. The theory posits that market movements unfold primarily in five “impulsive” waves, followed by three “corrective” waves.
In the case of XRP, the analyst states that the cryptocurrency has been in a corrective phase since reaching its peak in 2018, which is marked by an ABC correction pattern. Wave A saw a piercing decline to $0.105 in March 2020. Wave B saw a partial upward pullback to $1.96 in April 2021. Wave C, which XRP is currently in, is usually the final leg and involves another move down, often ending a corrective phase.
Analysis suggests that in this latest Wave C, XRP is going through its sub-waves. It is currently in its third wave, which is traditionally significant in terms of the depth and length of the price movement.
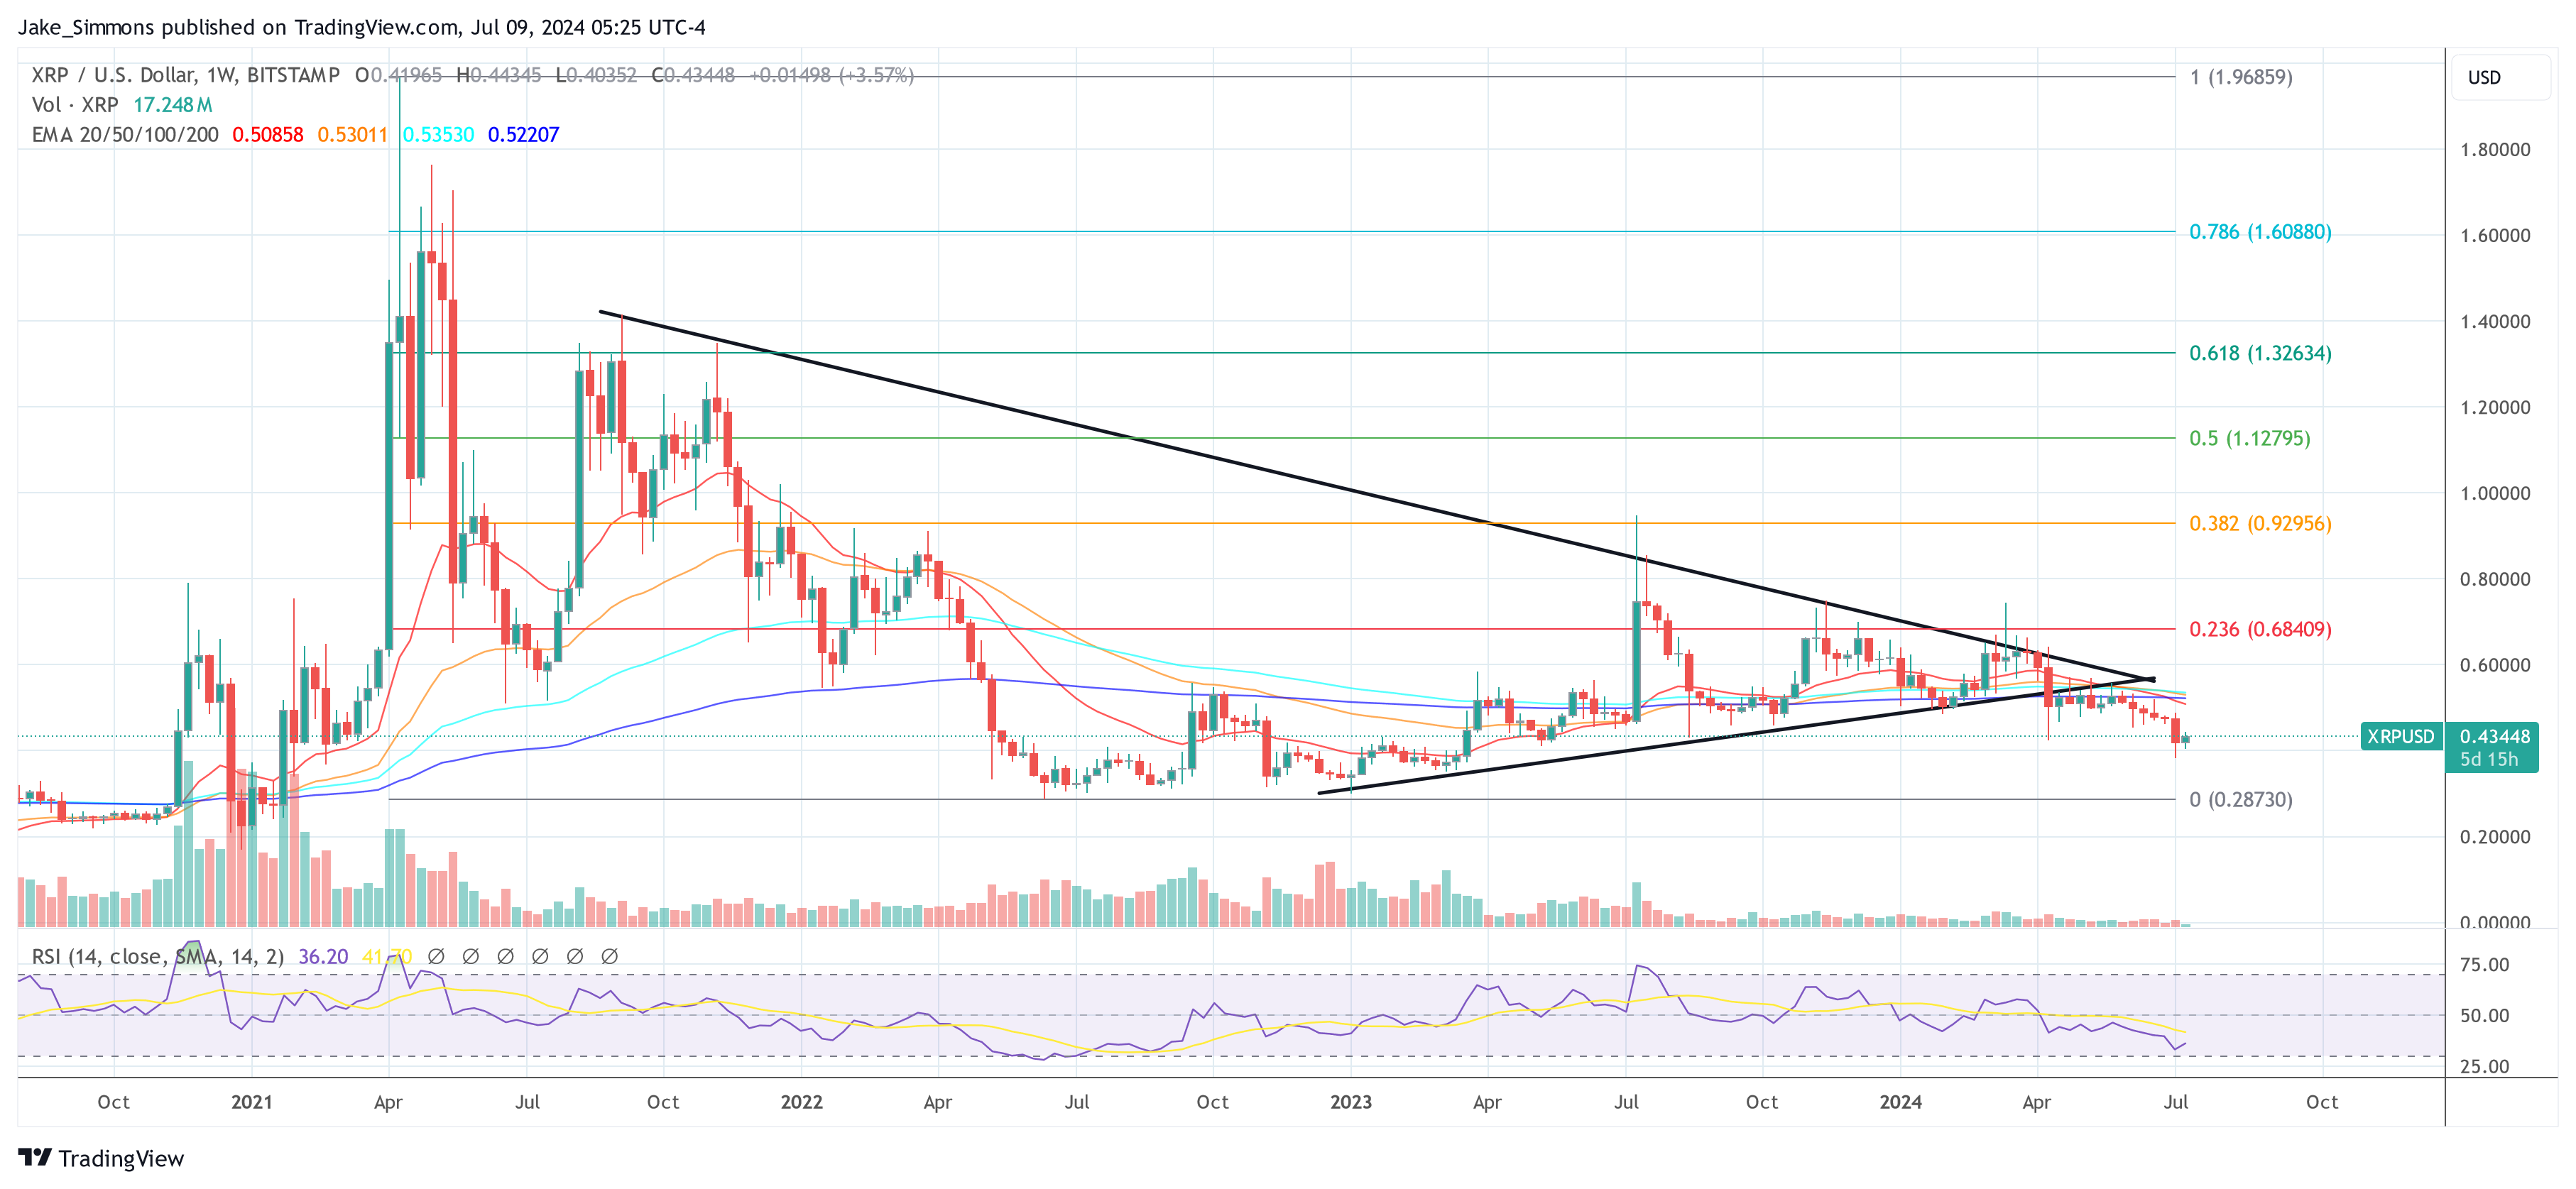
Interestingly, the chart also shows a gigantic triangle formation that has encompassed XRP price action for several years. A triangle in technical analysis often represents a period of consolidation before a decisive breakout in one direction.
According to @Ripple_Effect11, last week’s close below $0.42 confirmed a bearish breakout from this pattern and further supports the theory of a massive price crash. “Nobody is talking about this HUGE XRP triangle breakout. A weekly close below $0.42 is extremely bearish,” he stated.
The analyst’s first target is $0.33, where there may be some minor psychological support. The second, more significant target is $0.18, which could represent a stronger historical support zone. The third target is between $0.12 and $0.14, likely acting as transient support before more significant selling. This price level signals the end of the third wave.
During the fourth wave, the crypto analyst predicts that the price of XRP could rebound above $0.18 before the final 5 wave takes XRP even lower. The final target is $0.07 to $0.08, which would be a drop of over 80% from the current price level.
These targets are confirmed by technical indicators on the chart. MACD is trading below its signal line, highlighting bearish momentum. RSI is near 45, suggesting a lack of mighty buying pressure and the potential for further declines.
Ripple ruling could trigger trend reversal
Adding context to the technical analysis is the ongoing Ripple vs. SEC lawsuit, which the analyst estimates is expected to conclude by July 2026. The outcome of the legal battle is expected to have significant implications for the price of XRP.
“Smart money sees buy targets 3 and 4 as attractive ahead of a big utility pump from 2026 to 2030. Ripple vs SEC started in 2020. XRP was classified as NOT a security in 2023. Ripple wins the case and XRP pumps hard in 2026. Will you be patient?”, the crypto analyst concludes.
At the time of going to press, XRP was priced at $0.43448.

Featured image from Shutterstock, chart from TradingView.com
