
MATIC price has been in a consolidation zone for some time now, moving between USD 0.7730 and USD 0.6233, thus forming a support triangle flag. This follows a drop from a high of $0.9288 a few days ago, which has seen MATIC drop more than 25%.
Although the price MATIK continues to consolidate, gaining momentum for a potential breakout. Therefore, it is not advisable to trade at this point until a breakout occurs, which may be above or below the consolidation zone.
In this article we will look at possible price action when this is a potential breakout with consolidation takes place. MATIC’s price and market cap have declined recently, suggesting that bulls may be waiting out this surge.
At the time of writing, MATIC’s price is down 2.97%, trading around $0.6926 below its 100-day basic moving average (SMA) over the last 24 hours. Its market capitalization fell more than 5% in the past day to $6.91 billion. Meanwhile, the company’s trading volume rose to $374 million, up more than 1% over the past day.
MATIC on the 4-hour chart
Looking at the 4-hour time frame, MATIC is trying to break below the 100-day moving average, which suggests that prices may break below the consolidation zone and move bear.
Furthermore, using the Relative Strength Index (RSI) to analyze price action on a 4-hour time horizon, we see that the RSI line has crossed above the 50% level, heading towards the oversold zone, which suggests that the price may break below the consolidation zone level.
Meanwhile, on the daily time frame, you can also see that the price is trying to break below the bearish triangle, leaving the consolidation zone below the 100-day basic moving average.
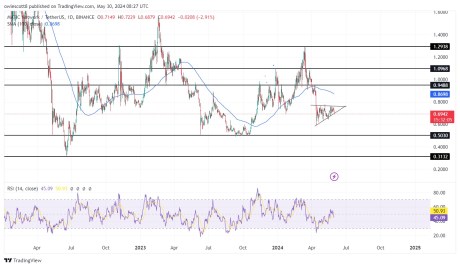
The one-day RSI also suggests that the MATIC price may break below the consolidation as the RSI signal line has broken below the 50% level and is heading towards the oversold zone. In particular, this means that sellers undermine buyers in the marketplace.
With this seller strength in the market, MATIC will continue to move lower as a break below the consolidation zone occurs.
Potential price action in the event of a breakout
To summarize, if a breakout above the consolidation zone occurs, MATIC will continue its upward move towards the resistance level at $0.9488. If the price breaks this resistance level, it could move even higher, testing the $1.0968 resistance level.
On the contrary, if MATIC price breaks below the consolidation zone, the price may start moving towards the support at USD 0.5030 as the downtrend continues. If the price breaks below this level, it may continue to fall towards the 0.3132 support level.
Featured image from Adobe Stock, chart from Tradingview.com
